Terme du glossaire : Décalage vers le rouge
Description : Ce terme peut désigner trois effets différents : le décalage Doppler, le décalage cosmologique ou le décalage gravitationnel. Le décalage vers le rouge Doppler est le contraire du décalage vers le bleu ; dans le cas du décalage vers le rouge, la source émettant le rayonnement électromagnétique s'éloigne de l'observateur, et la longueur d'onde du rayonnement électromagnétique est donc étirée vers des longueurs d'onde plus grandes (plus rouges). Ce phénomène est similaire à l'effet Doppler dans le contexte des ondes sonores. Le décalage vers le rouge cosmologique résulte du fait que le rayonnement électromagnétique émis par une source est décalé vers des longueurs d'onde plus grandes à cause de l'expansion physique de l'espace, contrairement à l'effet Doppler qui lui est dû au mouvement relatif. Le décalage gravitationnel vers le rouge désigne l'effet par lequel la longueur d'onde du rayonnement électromagnétique émis par une source est décalé vers des longueurs d'onde plus grandes, ou plutôt les photons associés perdent de l'énergie en essayant de quitter une région (puits gravitationnel) où la gravité est plus forte.
Termes associés :
Voir ce terme dans d'autres langues
Statut du terme et de sa définition : La définition initiale de ce terme en anglais a été aprouvée par un·e spécialiste de la recherche en astronomie et un·e spécialiste de l’éducation La traduction de ce terme et de sa définition n'ont pas encore été aprouvées
Le glossaire multilangue de l'OAE est un projet du Bureau de l'IAU de l'Astronomie pour l'Education (OAE) en collaboration avec le Bureau de l'IAU de diffusion de l'Astronomie (OAO). Les termes et définitions ont été choisis, écrits et relues grâce à un effort collectif de l'OAE, les Centres et les Noeuds de l'OAE, les Coordinateurs Nationaux de l'Astronomie pour l'Education de l'OAE(NAECs) et d'autres volontaires. La liste complète des crédits pour ce projet est disponible ici . Tous les termes du glossaire et leur définition sont déposés sous licence Creative Commons CC BY-4.0 et doivent être créditées au nom de "IAU OAE".
Si vous constatez une erreur dans ce terme ou sa définition, veuillez nous contacter .
Dans d'autres langues
- Arabe: الانزياح الأحمر
- Allemand: Rotverschiebung
- Anglais: Redshift
- Espagnol: Desplazamiento al rojo
- Italien: redshift
- Japonais: 赤方偏移 (Liens externes)
- Portugais brésilien: Desvio para o vermelho
- Chinois simplifié: 红移
- Chinois traditionnel: 紅移
Media associé
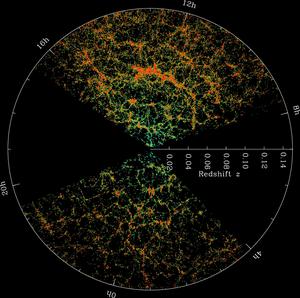
SDSS Redshift Map
Légende : This image shows a map of the distribution of galaxies and is based on redshift data from the Sloan Digital Sky Survey (SDSS). Redshift measurements provides information on the distances, positions and motions of the galaxies.
The Earth is located at the center of the image, and each dot represents a galaxy. The outer circle represents a ""distance"" of about 2 billion light years. The idea of distance in cosmology is complex because the usual measurement of distance is the separation between two points in space at the same time. However, because of the speed of light, the further a distance, the farther back in time we are observing. The numbers on the outer circle are Right Ascension coordinates mapped onto a flat circle, and provides information on the position of the galaxies on the sky. The colours used represent the ages of the stars in the galaxies, the redder, more strongly clustered points represent galaxies comprising of older stars. The dark wedges that do not contain any dots are regions that were not mapped by the SDSS due to dust from the Milky Way galaxy obscuring the view.
Crédit : M. Blanton and Sloan Digital Sky Survey
Lien vers les crédits
License: CC-BY-4.0 Creative Commons (CC) Attribution 4.0 International (CC BY 4.0) Icônes
Ceci pourrait vous intéresser également


- Ressources
- Moteur de recherche des ressources pédagogiques
- Parcourir les ressources pédagogiques par Sujet
- Parcourir les images
- AstroEdu - Activités en classe
- Grandes Idées - Littéracie en astronomie
- Glossaire
- Rapports de l'OAE
- L'astronomie pour l'Education à travers le monde
- Sélection de ressources externes