Glossary term: 光谱
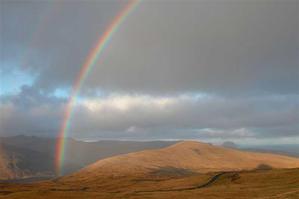
Description: 光穿过水滴,光线将分成紫色、蓝色、绿色到黄色、橙色和红色的基本颜色,这就形成了彩虹。每种颜色对应一个波长范围,彩虹的颜色是按照从紫到红的波长递增顺序排列的。这种按波长分解的光(或更一般的说法,电磁辐射)被称为光谱。
电磁辐射是由被称为“光子”的光粒子混合而成的。光谱相当于按能量对光子进行分类,并记录每个特定能量范围内有多少光子。根据量子力学的基本定律,这等同于按频率对光进行分类——这是描述光谱的另一种方式。
如果能量随波长(或光子能量,或频率)的变化平滑变化,则称为连续光谱。与此相反,光谱中某些波长处的尖锐凹陷或峰值分别称为吸收线和发射线。这些线是由于原子或分子(甚至原子核)内部不同能级之间的跃迁而产生的,它们会吸收或发射特定波长的辐射。例如,在可见光中,恒星会显示出带有吸收线的连续光谱。这些吸收线包含恒星化学成分的信息。对光谱的分析称为光谱学;能够记录光谱的仪器称为光谱仪、分光计或摄谱仪。
Related Terms:
See this term in other languages
Term and definition status: The original definition of this term in English have been approved by a research astronomer and a teacher The translation of this term and its definition is still awaiting approval
The OAE Multilingual Glossary is a project of the IAU Office of Astronomy for Education (OAE) in collaboration with the IAU Office of Astronomy Outreach (OAO). The terms and definitions were chosen, written and reviewed by a collective effort from the OAE, the OAE Centers and Nodes, the OAE National Astronomy Education Coordinators (NAECs) and other volunteers. You can find a full list of credits here. All glossary terms and their definitions are released under a Creative Commons CC BY-4.0 license and should be credited to "IAU OAE".
If you notice a factual or translation error in this glossary term or definition then please get in touch.
Related Media
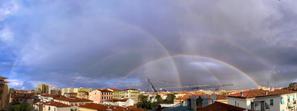
彩虹的24小时
Credit: Fabrizio Guasconi/IAU OAE (CC BY 4.0)
License: CC-BY-4.0 Creative Commons 署名 4.0 国际 (CC BY 4.0) icons
Related Diagrams
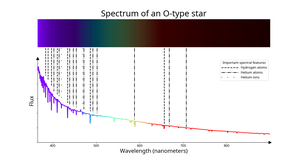
Spectrum of an O-type star
Credit: IAU OAE/SDSS/Niall Deacon
License: CC-BY-4.0 Creative Commons 署名 4.0 国际 (CC BY 4.0) icons
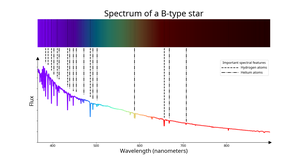
Spectrum of a B-type star
Credit: IAU OAE/SDSS/Niall Deacon
License: CC-BY-4.0 Creative Commons 署名 4.0 国际 (CC BY 4.0) icons
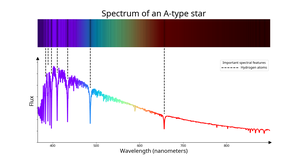
Spectrum of an A-type star
Credit: IAU OAE/SDSS/Niall Deacon
License: CC-BY-4.0 Creative Commons 署名 4.0 国际 (CC BY 4.0) icons
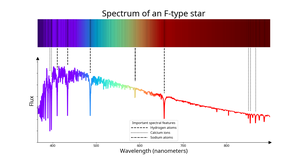
Spectrum of an F-type star
Credit: IAU OAE/SDSS/Niall Deacon
License: CC-BY-4.0 Creative Commons 署名 4.0 国际 (CC BY 4.0) icons
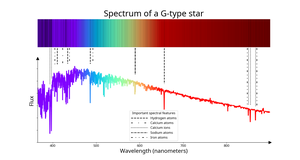
Spectrum of a G-type star
Credit: IAU OAE/SDSS/Niall Deacon
License: CC-BY-4.0 Creative Commons 署名 4.0 国际 (CC BY 4.0) icons
Related Activities
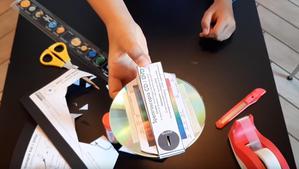
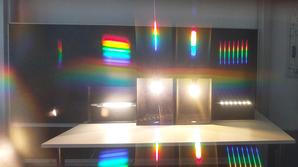
Hunting for spectra
astroEDU educational activity (links to astroEDU website) Description: Learn about light and spectra building a spectroscope with a CD!
License: CC-BY-4.0 Creative Commons 署名 4.0 国际 (CC BY 4.0) icons
Tags:
Hands-on
, Experiment
, prism
Age Ranges:
8-10
, 10-12
, 12-14
, 14-16
, 16-19
Education Level:
Informal
, Middle School
, Primary
, Secondary
Areas of Learning:
Guided-discovery learning
Costs:
Low Cost
Duration:
1 hour
Group Size:
Individual
Skills:
Asking questions
, Constructing explanations
, Planning and carrying out investigations
Reading the Rainbow
astroEDU educational activity (links to astroEDU website) Description: By understanding how rainbows work, you can discover about light and its properties, learning about stars, nebulae, galaxies, and our Universe.
License: CC-BY-4.0 Creative Commons 署名 4.0 国际 (CC BY 4.0) icons
Age Ranges:
14-16
, 16-19
, 19+
Education Level:
Informal
, Middle School
, Secondary
, University
Areas of Learning:
Interactive Lecture
, Observation based
, Social Research
Costs:
Low Cost
Duration:
1 hour 30 mins
Group Size:
Group
Skills:
Analysing and interpreting data
, Asking questions
, Engaging in argument from evidence
Find the hidden rainbows
astroEDU educational activity (links to astroEDU website) Description: Let’s reveal hidden rainbows around us and the physical processes that make them!
License: CC-BY-4.0 Creative Commons 署名 4.0 国际 (CC BY 4.0) icons
Age Ranges:
10-12
, 12-14
, 14-16
Education Level:
Middle School
, Secondary
Areas of Learning:
Interactive Lecture
, Observation based
, Social Research
Costs:
Medium Cost
Duration:
1 hour