Glossary term: 光譜
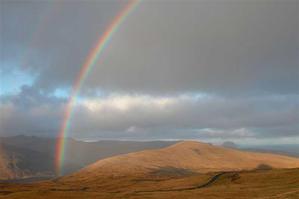
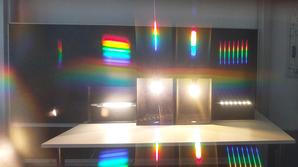
Description: 光穿過水滴,光線將分成紫色、藍色、綠色到黃色、橙色和紅色的基本顏色,這就形成了彩虹。每種顏色對應一個波長範圍,彩虹的顏色是按照從紫到紅的波長遞增順序排列的。這種按波長分解的光(或更一般的說法,電磁輻射)被稱為光譜。
電磁輻射是由被稱為“光子”的光粒子混合而成的。光譜相當於按能量對光子進行分類,並記錄每個特定能量範圍內有多少光子。根據量子力學的基本定律,這等同於按頻率對光進行分類——這是描述光譜的另一種方式。
如果能量隨波長(或光子能量,或頻率)的變化平滑變化,則稱為連續光譜。與此相反,光譜中某些波長處的尖銳凹陷或峰值分別稱為吸收線和發射線。這些線是由於原子或分子(甚至原子核)內部不同能級之間的躍遷而產生的,它們會吸收或發射特定波長的輻射。例如,在可見光中,恆星會顯示出帶有吸收線的連續光譜。這些吸收線包含恆星化學成分的信息。對光譜的分析稱為光譜學;能夠記錄光譜的儀器稱為光譜儀、分光計或攝譜儀。
Related Terms:
See this term in other languages
Term and definition status: The original definition of this term in English have been approved by a research astronomer and a teacher The translation of this term and its definition is still awaiting approval
This is an automated transliteration of the simplified Chinese translation of this term
The OAE Multilingual Glossary is a project of the IAU Office of Astronomy for Education (OAE) in collaboration with the IAU Office of Astronomy Outreach (OAO). The terms and definitions were chosen, written and reviewed by a collective effort from the OAE, the OAE Centers and Nodes, the OAE National Astronomy Education Coordinators (NAECs) and other volunteers. You can find a full list of credits here. All glossary terms and their definitions are released under a Creative Commons CC BY-4.0 license and should be credited to "IAU OAE".
If you notice a factual or translation error in this glossary term or definition then please get in touch.
Related Media
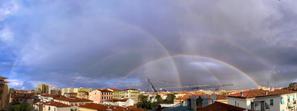
彩虹的24小時
Credit: Fabrizio Guasconi/IAU OAE (CC BY 4.0)
License: CC-BY-4.0 Creative Commons 姓名標示 4.0 國際 (CC BY 4.0) icons
Related Diagrams
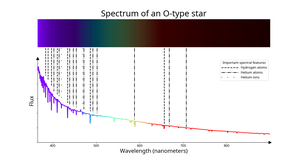
Spectrum of an O-type star
Credit: IAU OAE/SDSS/Niall Deacon
License: CC-BY-4.0 Creative Commons 姓名標示 4.0 國際 (CC BY 4.0) icons
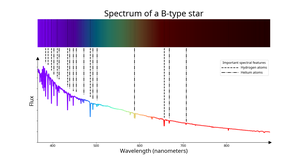
Spectrum of a B-type star
Credit: IAU OAE/SDSS/Niall Deacon
License: CC-BY-4.0 Creative Commons 姓名標示 4.0 國際 (CC BY 4.0) icons
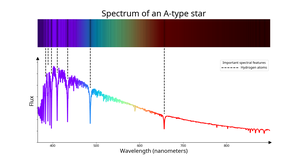
Spectrum of an A-type star
Credit: IAU OAE/SDSS/Niall Deacon
License: CC-BY-4.0 Creative Commons 姓名標示 4.0 國際 (CC BY 4.0) icons
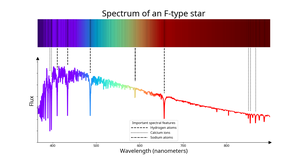
Spectrum of an F-type star
Credit: IAU OAE/SDSS/Niall Deacon
License: CC-BY-4.0 Creative Commons 姓名標示 4.0 國際 (CC BY 4.0) icons
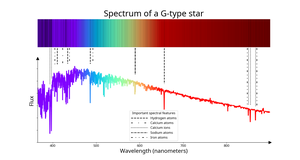
Spectrum of a G-type star
Credit: IAU OAE/SDSS/Niall Deacon
License: CC-BY-4.0 Creative Commons 姓名標示 4.0 國際 (CC BY 4.0) icons
Related Activities
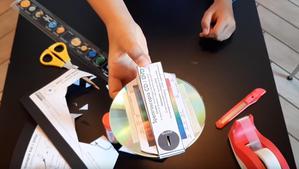
Hunting for spectra
astroEDU educational activity (links to astroEDU website) Description: Learn about light and spectra building a spectroscope with a CD!
License: CC-BY-4.0 Creative Commons 姓名標示 4.0 國際 (CC BY 4.0) icons
Tags:
Hands-on
, Experiment
, prism
Age Ranges:
8-10
, 10-12
, 12-14
, 14-16
, 16-19
Education Level:
Informal
, Middle School
, Primary
, Secondary
Areas of Learning:
Guided-discovery learning
Costs:
Low Cost
Duration:
1 hour
Group Size:
Individual
Skills:
Asking questions
, Constructing explanations
, Planning and carrying out investigations
Reading the Rainbow
astroEDU educational activity (links to astroEDU website) Description: By understanding how rainbows work, you can discover about light and its properties, learning about stars, nebulae, galaxies, and our Universe.
License: CC-BY-4.0 Creative Commons 姓名標示 4.0 國際 (CC BY 4.0) icons
Age Ranges:
14-16
, 16-19
, 19+
Education Level:
Informal
, Middle School
, Secondary
, University
Areas of Learning:
Interactive Lecture
, Observation based
, Social Research
Costs:
Low Cost
Duration:
1 hour 30 mins
Group Size:
Group
Skills:
Analysing and interpreting data
, Asking questions
, Engaging in argument from evidence
Find the hidden rainbows
astroEDU educational activity (links to astroEDU website) Description: Let’s reveal hidden rainbows around us and the physical processes that make them!
License: CC-BY-4.0 Creative Commons 姓名標示 4.0 國際 (CC BY 4.0) icons
Age Ranges:
10-12
, 12-14
, 14-16
Education Level:
Middle School
, Secondary
Areas of Learning:
Interactive Lecture
, Observation based
, Social Research
Costs:
Medium Cost
Duration:
1 hour