Glossarbegriffe: Spektrum
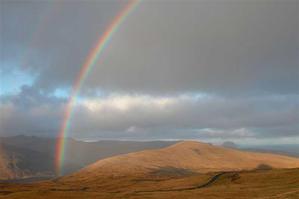
Description: Ein Regenbogen entsteht, wenn Wassertröpfchen das Licht in die Spektralfarben Violett, Blau, Grün, Gelb, Orange und Rot zerlegen. Jede Farbe entspricht einem Bereich von Wellenlängen, und die Regenbogenfarben sind in der Reihenfolge zunehmender Wellenlänge von violett bis rot angeordnet. Diese Art von zerlegtem Licht oder allgemeiner von elektromagnetischer Strahlung nach Wellenlängen wird als Spektrum bezeichnet.
Elektromagnetische Strahlung ist eine Mischung aus Lichtteilchen, die "Photonen" genannt werden. Um ein Spektrum (beispielsweise von der Sonne oder von einem anderen astronomischen Objekt) zu erstellen, sortiert man die Photonen nach ihrer Energie und hält fest, wie viele Photonen es in jedem Energiebereich gibt. Nach einem Grundgesetz der Quantenmechanik ist dies gleichbedeutend mit der Sortierung des Lichts nach der Frequenz - eine weitere Möglichkeit, ein Spektrum zu erfassen.
Wenn die Energiemenge gleichmäßig mit der Wellenlänge (oder der Photonenenergie oder der Frequenz) variiert,
wird das Spektrum als kontinuierlich bezeichnet. Im Gegensatz dazu werden scharfe Einbrüche oder Spitzen in einem Spektrum bei bestimmten Wellenlängen als Absorptions- bzw. Emissionslinien bezeichnet. Solche Linien entstehen aufgrund von
Übergängen zwischen verschiedenen Energieniveaus innerhalb von Atomen oder Molekülen (oder sogar Atomkernen), die entweder Strahlung bei bestimmten Wellenlängen absorbieren oder emittieren. Im sichtbaren Licht zeigen Sterne beispielsweise kontinuierliche Spektren mit Absorptionslinien. Diese Linien geben Aufschluss über die chemische Zusammensetzung eines Sterns. Die Analyse von Spektren wird als Spektroskopie bezeichnet; Instrumente, die die Aufnahme von Spektren ermöglichen, werden Spektroskope, Spektrometer oder Spektrographen genannt.
Zugehörige Glossarbegriffe:
See this term in other languages
Term and definition status: The original definition of this term in English have been approved by a research astronomer and a teacher The translation of this term and its definition is still awaiting approval
The OAE Multilingual Glossary is a project of the IAU Office of Astronomy for Education (OAE) in collaboration with the IAU Office of Astronomy Outreach (OAO). The terms and definitions were chosen, written and reviewed by a collective effort from the OAE, the OAE Centers and Nodes, the OAE National Astronomy Education Coordinators (NAECs) and other volunteers. You can find a full list of credits here. All glossary terms and their definitions are released under a Creative Commons CC BY-4.0 license and should be credited to "IAU OAE".
If you notice a factual or translation error in this glossary term or definition then please get in touch.
Zugehörige Medien
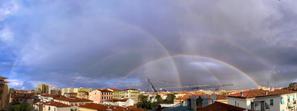
24 Hours of Rainbow
Bildnachweis: Fabrizio Guasconi/IAU OAE (CC BY 4.0)
License: CC-BY-4.0 Creative Commons Namensnennung 4.0 International (CC BY 4.0) icons
Related Diagrams
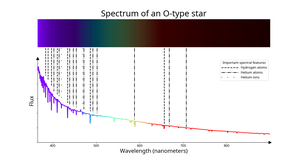
Spectrum of an O-type star
Bildnachweis: IAU OAE/SDSS/Niall Deacon
License: CC-BY-4.0 Creative Commons Namensnennung 4.0 International (CC BY 4.0) icons
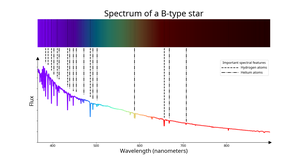
Spectrum of a B-type star
Bildnachweis: IAU OAE/SDSS/Niall Deacon
License: CC-BY-4.0 Creative Commons Namensnennung 4.0 International (CC BY 4.0) icons
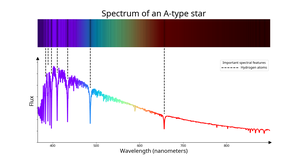
Spectrum of an A-type star
Bildnachweis: IAU OAE/SDSS/Niall Deacon
License: CC-BY-4.0 Creative Commons Namensnennung 4.0 International (CC BY 4.0) icons
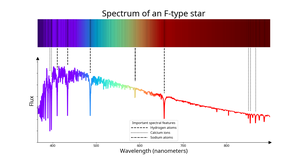
Spectrum of an F-type star
Bildnachweis: IAU OAE/SDSS/Niall Deacon
License: CC-BY-4.0 Creative Commons Namensnennung 4.0 International (CC BY 4.0) icons
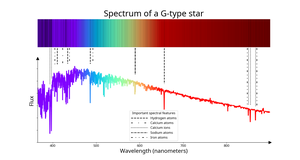
Spectrum of a G-type star
Bildnachweis: IAU OAE/SDSS/Niall Deacon
License: CC-BY-4.0 Creative Commons Namensnennung 4.0 International (CC BY 4.0) icons
Related Activities
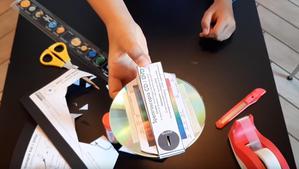
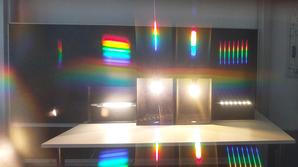
Hunting for spectra
astroEDU educational activity (links to astroEDU website) Description: Learn about light and spectra building a spectroscope with a CD!
License: CC-BY-4.0 Creative Commons Namensnennung 4.0 International (CC BY 4.0) icons
Tags:
Hands-on
, Experiment
, prism
Age Ranges:
8-10
, 10-12
, 12-14
, 14-16
, 16-19
Education Level:
Informal
, Middle School
, Primary
, Secondary
Areas of Learning:
Guided-discovery learning
Costs:
Low Cost
Duration:
1 hour
Group Size:
Individual
Skills:
Asking questions
, Constructing explanations
, Planning and carrying out investigations
Reading the Rainbow
astroEDU educational activity (links to astroEDU website) Description: By understanding how rainbows work, you can discover about light and its properties, learning about stars, nebulae, galaxies, and our Universe.
License: CC-BY-4.0 Creative Commons Namensnennung 4.0 International (CC BY 4.0) icons
Age Ranges:
14-16
, 16-19
, 19+
Education Level:
Informal
, Middle School
, Secondary
, University
Areas of Learning:
Interactive Lecture
, Observation based
, Social Research
Costs:
Low Cost
Duration:
1 hour 30 mins
Group Size:
Group
Skills:
Analysing and interpreting data
, Asking questions
, Engaging in argument from evidence
Find the hidden rainbows
astroEDU educational activity (links to astroEDU website) Description: Let’s reveal hidden rainbows around us and the physical processes that make them!
License: CC-BY-4.0 Creative Commons Namensnennung 4.0 International (CC BY 4.0) icons
Age Ranges:
10-12
, 12-14
, 14-16
Education Level:
Middle School
, Secondary
Areas of Learning:
Interactive Lecture
, Observation based
, Social Research
Costs:
Medium Cost
Duration:
1 hour