Glossary term: Hertzsprung–Russell (HR) Diagram
Description: The Hertzsprung–Russell (or HR) diagram is a graph of two observational properties of stars: On the one axis, the total power emitted by stars (luminosity), and on the other axis either their effective temperature or spectral type. Where the effective temperature is used, it is shown on a logarithmic scale, increasing from right to left. The HR diagram is named after two scientists: Ejnar Hertzsprung and Henry Norris Russell who first made different versions of this graph in order to understand the properties of stars. The data points corresponding to the so-called "main sequence stars" lie on a diagonal band from the upper left to lower right in this graph. Data points corresponding to giant stars lie above and to the right of the main-sequence band. White dwarfs lie below and to the left of the band.
The HR diagram can also be a useful framework for representing the evolution of a star over time. Once a star has formed it will be positioned on the main sequence of the HR diagram, and its temperature and luminosity will remain roughly constant for some time. Later, as it evolves, the star's temperature will drop and its luminosity will increase. This means the star's position on the HR diagram moves up and to the right, away from the main sequence towards the giant branch. A star's evolution, specifically its changes in temperature and luminosity, can be represented by a curve in the HR diagram. Thus a star's evolutionary state can be determined from its temperature and luminosity using the HR diagram.
Related Terms:
- Dwarf Star
- Giant Star
- Luminosity
- Main Sequence
- Star
- Supergiant Star
- White Dwarf
- Effective Temperature
- Luminosity Class
See this term in other languages
Term and definition status: This term and its definition have been approved by a research astronomer and a teacher
The OAE Multilingual Glossary is a project of the IAU Office of Astronomy for Education (OAE) in collaboration with the IAU Office of Astronomy Outreach (OAO). The terms and definitions were chosen, written and reviewed by a collective effort from the OAE, the OAE Centers and Nodes, the OAE National Astronomy Education Coordinators (NAECs) and other volunteers. You can find a full list of credits here. All glossary terms and their definitions are released under a Creative Commons CC BY-4.0 license and should be credited to "IAU OAE".
If you notice a factual error in this glossary definition then please get in touch.
Related Diagrams
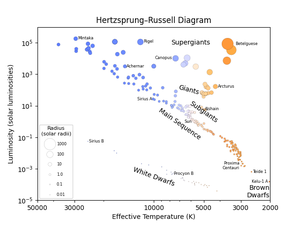
Hertzsprung-Russell diagram
Credit: IAU OAE/Niall Deacon
License: CC-BY-4.0 Creative Commons Attribution 4.0 International (CC BY 4.0) icons