Glossary term: 光谱类型
Description: 恒星根据其光谱中的特征被划分为不同的光谱类型。
对于大多数恒星来说,光谱类型主要基于恒星表面的温度,按照温度从高到低的顺序依次为:O、B、A、F、G、K 和 M。这个序列最近扩展到了更冷的类型L、T和Y。这三种类型主要代表褐矮星,但一些光谱类型为 L 的天体是恒星,而不是褐矮星。
还有一些字母也被用来划分特殊类型的恒星。碳星是光谱中具有强烈含碳分子特征的恒星。它们被称为C型。S型恒星介于K或M型和C型之间,其表面氧和碳的丰度几乎相等。白矮星根据其光谱特征分为一系列不同类型;所有这些类型都以字母 D 开头(DA、DB 等)。具有宽发射线的大质量高温恒星被分为一系列以 W 开头的类型(WN、WC、WO)。
目前的命名法源于哈佛大学天文台的第一次现代分类尝试。最初的类别按字母顺序标记为 A-Q,后来按温度序列重新排序,形成了今天仍在使用的主要类型。主要的光谱类别又被进一步细分,由从 0 到 9 的数字表示。太阳的光谱类型为 G2。附加字母被用于表示特殊特征(如 e 表示具有明亮发射线的恒星),光度等级也可以用罗马数字表示。
Related Terms:
See this term in other languages
Term and definition status: The original definition of this term in English have been approved by a research astronomer and a teacher The translation of this term and its definition is still awaiting approval
The OAE Multilingual Glossary is a project of the IAU Office of Astronomy for Education (OAE) in collaboration with the IAU Office of Astronomy Outreach (OAO). The terms and definitions were chosen, written and reviewed by a collective effort from the OAE, the OAE Centers and Nodes, the OAE National Astronomy Education Coordinators (NAECs) and other volunteers. You can find a full list of credits here. All glossary terms and their definitions are released under a Creative Commons CC BY-4.0 license and should be credited to "IAU OAE".
If you notice a factual or translation error in this glossary term or definition then please get in touch.
Related Diagrams
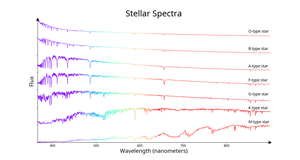
Stellar spectral types
Credit: IAU OAE/SDSS/Niall Deacon
License: CC-BY-4.0 Creative Commons 署名 4.0 国际 (CC BY 4.0) icons
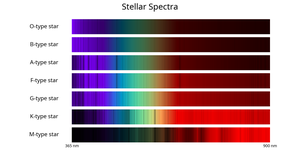
Stellar spectral types - bands
Credit: IAU OAE/SDSS/Niall Deacon
License: CC-BY-4.0 Creative Commons 署名 4.0 国际 (CC BY 4.0) icons