This page describes an image 赫羅圖
Download PDF File (PDF file 94.27 kB)
Diagram caption:
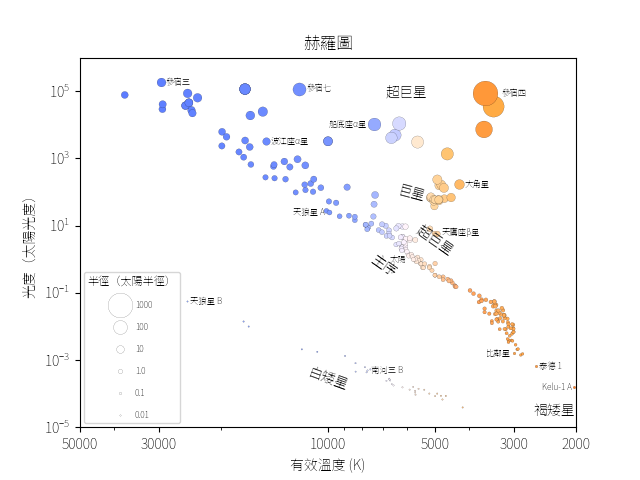
這張圖展示了不同恆星溫度和亮度。每個點的大小代表恆星的半徑,顏色代表人眼所看到的顏色。恆星的顏色從淡藍色到淡橙紅色不等,沒有恆星具有像紅、綠或藍這樣的純顏色,因為恆星的光譜包含了許多不同顏色的光。然而,最紅的恆星通常被稱為紅恆星,最藍的恆星被稱為藍恆星。為了展示不同類型的恆星,製作這個圖表的恆星樣本選擇上並沒有反映出每種類型恆星的實際數量比例。
從左上到右下是一條長長的恆星帶,這些恆星在其核心燃燒氫氣,這被稱為主序。在這條線上,我們可以看到參宿三(Mintaka)、波江座α星(Achernar)、天狼星A(Sirius A)、太陽和比鄰星(Proxima Centauri)等恆星。在主序線右下方的比鄰星週圍的天體被稱為紅矮星。在紅矮星的右下方是Teide 1和Kelu-1 A。這兩個天體是褐矮星,它們的質量太低,核心沒有足夠的熱量來持續地進行氫融合。由於它們不燃燒氫,褐矮星不被認為是主序星。"褐矮星"這個名字與它們的顏色無關。
在主序星的上方,我們發現次巨星、巨星和超巨星。這些是已經完成了核心的氫燃燒並演化成更大天體的恆星。恆星的亮度取決於其溫度和大小,因此巨星比具有較小半徑但相同溫度的恆星更亮。隨著時間的推移,這些天體將走向生命的盡頭,經歷行星狀星雲階段或變成超新星。以行星狀星雲階段結束生命的恆星會形成一種叫做白矮星的恆星殘骸。這種天體比相同溫度的恆星小得多,因此更暗淡,並且位於主序星帶的顯著下方。以超新星結束生命的恆星會成為黑洞或中子星。這些在這個圖表上沒有顯示。
Diagram credit: IAU OAE/Niall Deacon.
Diagram translation status: Not yet approved by a reviewer
Diagram translators: An automated transliteration from the simplified Chinese translation by - Lin Shijie
Related glossary terms:
主序
, 亞巨星
, 光度
, 光度等級
, 巨星
, 恆星演化
, 有效溫度
, 白矮星
, 褐矮星
, 赫羅圖
, 超巨星
, 顏色
Categories:
Stars
Diagram license: Creative Commons 姓名標示 4.0 國際 (CC BY 4.0) Creative Commons 姓名標示 4.0 國際 (CC BY 4.0) icons
Want to make your own version of this diagram? Then have a look at the code that
produced this diagram on Github
In Other Languages
英語: Hertzsprung-Russell diagram法語: Diagramme de Hertzsprung-Russell
簡體中文: 赫罗图
西班牙語: Diagrama Hertzsprung-Russell
義大利語: Diagramma di Hertzsprung-Russell
Want to create your own translation? Then have a look at the code that produced this diagram on Github
The diagram captions presented on the OAE website were written, translated and reviewed by a collective effort from the OAE, the OAE Centers and Nodes, the OAE National Astronomy Education Coordinators (NAECs) and other volunteers. You can find a full list of credits for our translation project here. All media file captions are released under a Creative Commons CC BY-4.0 license and should be credited to "IAU OAE". The media files themselves may have different licenses (see above) and should be credited as listed above under "credit".
If you notice a error in this diagram or its caption then please get in touch.