Glossary term: 光譜類型
Description: 恆星根據其光譜中的特徵被劃分為不同的光譜類型。
對於大多數恆星來說,光譜類型主要基於恆星表面的溫度,按照溫度從高到低的順序依次為:O、B、A、F、G、K 和 M。這個序列最近擴展到了更冷的類型L、T和Y。這三種類型主要代表褐矮星,但一些光譜類型為 L 的天體是恆星,而不是褐矮星。
還有一些字母也被用來劃分特殊類型的恆星。碳星是光譜中具有強烈含碳分子特徵的恆星。它們被稱為C型。S型恆星介於K或M型和C型之間,其表面氧和碳的丰度幾乎相等。白矮星根據其光譜特徵分為一系列不同類型;所有這些類型都以字母 D 開頭(DA、DB 等)。具有寬發射線的大質量高溫恆星被分為一系列以 W 開頭的類型(WN、WC、WO)。
目前的命名法源於哈佛大學天文臺的第一次現代分類嘗試。最初的類別按字母順序標記為 A-Q,後來按溫度序列重新排序,形成了今天仍在使用的主要類型。主要的光譜類別又被進一步細分,由從 0 到 9 的數字表示。太陽的光譜類型為 G2。附加字母被用於表示特殊特徵(如 e 表示具有明亮發射線的恆星),光度等級也可以用羅馬數字表示。
Related Terms:
See this term in other languages
Term and definition status: The original definition of this term in English have been approved by a research astronomer and a teacher The translation of this term and its definition is still awaiting approval
This is an automated transliteration of the simplified Chinese translation of this term
The OAE Multilingual Glossary is a project of the IAU Office of Astronomy for Education (OAE) in collaboration with the IAU Office of Astronomy Outreach (OAO). The terms and definitions were chosen, written and reviewed by a collective effort from the OAE, the OAE Centers and Nodes, the OAE National Astronomy Education Coordinators (NAECs) and other volunteers. You can find a full list of credits here. All glossary terms and their definitions are released under a Creative Commons CC BY-4.0 license and should be credited to "IAU OAE".
If you notice a factual or translation error in this glossary term or definition then please get in touch.
Related Diagrams
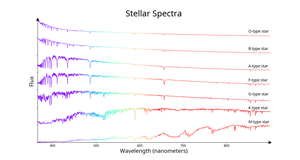
Stellar spectral types
Credit: IAU OAE/SDSS/Niall Deacon
License: CC-BY-4.0 Creative Commons 姓名標示 4.0 國際 (CC BY 4.0) icons
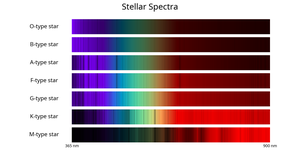
Stellar spectral types - bands
Credit: IAU OAE/SDSS/Niall Deacon
License: CC-BY-4.0 Creative Commons 姓名標示 4.0 國際 (CC BY 4.0) icons