Glossary term: Spectrum
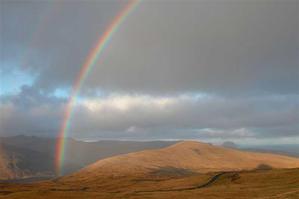
Description: A rainbow forms when water droplets split light into elementary colors, from violet, blue, and green, to yellow, orange, and red. Each color corresponds to a range of wavelengths, and the rainbow colors are arranged in order of increasing wavelength from violet to red. This kind of decomposed light, or electromagnetic radiation in general, into different wavelengths is called a spectrum.
Electromagnetic radiation is a mixture of light particles called "photons". Creating a spectrum amounts to sorting photons by energy and documenting how many photons there are in each given energy range. By a basic law of quantum mechanics, this is equivalent to sorting light by frequency – yet another way of documenting a spectrum.
If the amount of energy varies smoothly with wavelength (or photon energy, or frequency), the spectrum is called continuous. In contrast, sharp dips or peaks in a spectrum at certain wavelengths are called absorption and emission lines, respectively. Such lines arise due to transitions between different energy levels within atoms or molecules (or even atomic nuclei), either absorbing or emitting radiation at specific wavelengths. For example, in visible light, stars show continuous spectra with absorption lines. The lines carry information about a star's chemical composition. The analysis of spectra is known as spectroscopy; instruments that allow for the recording of spectra are called spectroscopes, spectrometers, or spectrographs.
Related Terms:
See this term in other languages
Term and definition status: This term and its definition have been approved by a research astronomer and a teacher
The OAE Multilingual Glossary is a project of the IAU Office of Astronomy for Education (OAE) in collaboration with the IAU Office of Astronomy Outreach (OAO). The terms and definitions were chosen, written and reviewed by a collective effort from the OAE, the OAE Centers and Nodes, the OAE National Astronomy Education Coordinators (NAECs) and other volunteers. You can find a full list of credits here. All glossary terms and their definitions are released under a Creative Commons CC BY-4.0 license and should be credited to "IAU OAE".
If you notice a factual error in this glossary definition then please get in touch.
Related Media
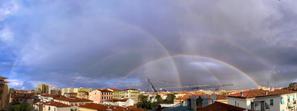
24 Hours of Rainbow
Credit: Fabrizio Guasconi/IAU OAE (CC BY 4.0)
License: CC-BY-4.0 Creative Commons Attribution 4.0 International (CC BY 4.0) icons
Related Diagrams
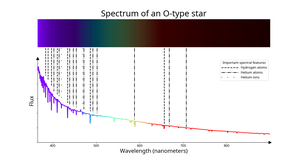
Spectrum of an O-type star
Credit: IAU OAE/SDSS/Niall Deacon
License: CC-BY-4.0 Creative Commons Attribution 4.0 International (CC BY 4.0) icons
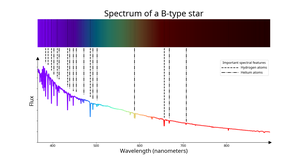
Spectrum of a B-type star
Credit: IAU OAE/SDSS/Niall Deacon
License: CC-BY-4.0 Creative Commons Attribution 4.0 International (CC BY 4.0) icons
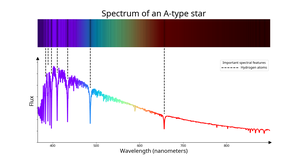
Spectrum of an A-type star
Credit: IAU OAE/SDSS/Niall Deacon
License: CC-BY-4.0 Creative Commons Attribution 4.0 International (CC BY 4.0) icons
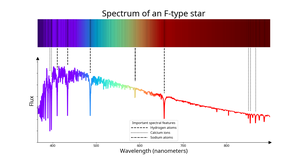
Spectrum of an F-type star
Credit: IAU OAE/SDSS/Niall Deacon
License: CC-BY-4.0 Creative Commons Attribution 4.0 International (CC BY 4.0) icons
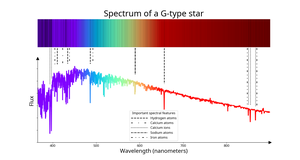
Spectrum of a G-type star
Credit: IAU OAE/SDSS/Niall Deacon
License: CC-BY-4.0 Creative Commons Attribution 4.0 International (CC BY 4.0) icons
Related Activities
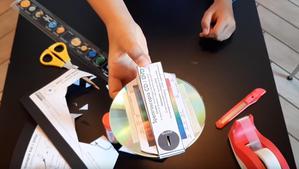
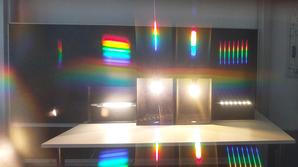
Hunting for spectra
astroEDU educational activity (links to astroEDU website) Description: Learn about light and spectra building a spectroscope with a CD!
License: CC-BY-4.0 Creative Commons Attribution 4.0 International (CC BY 4.0) icons
Tags:
Hands-on
, Experiment
, prism
Age Ranges:
8-10
, 10-12
, 12-14
, 14-16
, 16-19
Education Level:
Informal
, Middle School
, Primary
, Secondary
Areas of Learning:
Guided-discovery learning
Costs:
Low Cost
Duration:
1 hour
Group Size:
Individual
Skills:
Asking questions
, Constructing explanations
, Planning and carrying out investigations
Reading the Rainbow
astroEDU educational activity (links to astroEDU website) Description: By understanding how rainbows work, you can discover about light and its properties, learning about stars, nebulae, galaxies, and our Universe.
License: CC-BY-4.0 Creative Commons Attribution 4.0 International (CC BY 4.0) icons
Age Ranges:
14-16
, 16-19
, 19+
Education Level:
Informal
, Middle School
, Secondary
, University
Areas of Learning:
Interactive Lecture
, Observation based
, Social Research
Costs:
Low Cost
Duration:
1 hour 30 mins
Group Size:
Group
Skills:
Analysing and interpreting data
, Asking questions
, Engaging in argument from evidence
Find the hidden rainbows
astroEDU educational activity (links to astroEDU website) Description: Let’s reveal hidden rainbows around us and the physical processes that make them!
License: CC-BY-4.0 Creative Commons Attribution 4.0 International (CC BY 4.0) icons
Age Ranges:
10-12
, 12-14
, 14-16
Education Level:
Middle School
, Secondary
Areas of Learning:
Interactive Lecture
, Observation based
, Social Research
Costs:
Medium Cost
Duration:
1 hour