Glossary term: Electromagnetic Radiation
Description: When 19th century physicists described electric and magnetic phenomena, they found that there is a way for patterns of electric and magnetic fields to propagate together through space at the speed of light, even in situations where there are no electric charges nearby. These waves are known as electromagnetic waves, or electromagnetic radiation. Elementary electromagnetic waves can be classified according to their wavelengths, and the resulting electromagnetic spectrum includes, from shorter to longer wavelengths: gamma rays, X-rays, ultraviolet, visible light, infrared, submillimeter, and radio waves (including millimeter/microwaves). Electromagnetic radiation from distant astronomical objects is astronomers' most important source of information about such objects.
Related Terms:
- Electromagnetic Force
- Gamma Ray
- Infrared (IR)
- Light
- Microwave Radiation
- Ultraviolet
- Visible Spectrum
- Submillimeter Astronomy
- X-ray
See this term in other languages
Term and definition status: This term and its definition have been approved by a research astronomer and a teacher
The OAE Multilingual Glossary is a project of the IAU Office of Astronomy for Education (OAE) in collaboration with the IAU Office of Astronomy Outreach (OAO). The terms and definitions were chosen, written and reviewed by a collective effort from the OAE, the OAE Centers and Nodes, the OAE National Astronomy Education Coordinators (NAECs) and other volunteers. You can find a full list of credits here. All glossary terms and their definitions are released under a Creative Commons CC BY-4.0 license and should be credited to "IAU OAE".
If you notice a factual error in this glossary definition then please get in touch.
In Other Languages
- Arabic: الإشعاع الكهرومغناطيسي
- German: Elektromagnetische Strahlung
- Spanish: Radiación electromagnética
- French: Rayonnement électromagnétique
- Hindi: इलेक्ट्रोमॅग्नेटिक रेडिएशन (विद्युतचुंबकीय विकिरण)
- Italian: Radiazione elettromagnetica
- Japanese: 放射 (external link)
- Korean: 전자기복사
- Marathi: इलेक्ट्रोमॅग्नेटिक रेडिएशन (विद्युत चुंबकीय विकिरण)
- Brazilian Portuguese: Radiação eletromagnética
- Simplified Chinese: 电磁辐射
- Traditional Chinese: 電磁輻射
Related Diagrams
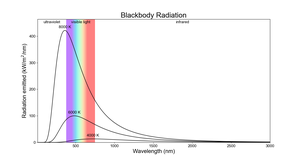
Blackbody Radiation
Caption: The curves of emitted radiation from blackbodies of different temperatures. The x-axis shows wavelength and the y-axis shows the amount of energy emitted every second by a square meter of the surface of that blackbody at each wavelength.
The hotter the body, the shorter the wavelength and the bluer the light it emits its maximum amount of energy at. Despite the coolest body in this plot peaking in red light, the other hotter bodies all emit more red light than the coolest body.
Credit: IAU OAE/Niall Deacon
License: CC-BY-4.0 Creative Commons Attribution 4.0 International (CC BY 4.0) icons
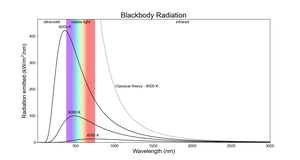
Blackbody Radiation - UV Catastrophe
Caption: The curves of emitted radiation from blackbodies of different temperatures. The x-axis shows wavelength and the y-axis shows the amount of energy emitted every second by a square meter of the surface of that blackbody at each wavelength.
The hotter the body, the shorter the wavelength and the bluer the light it emits its maximum amount of energy at. Despite the coolest body in this plot peaking in red light, the other hotter bodies all emit more red light than the coolest body.
The dotted line shows the emitted radiation predicted by classical theory prior to modern quantum mechanics. This prediction tends to infinity at shorter wavelengths for any blackbody temperature above zero and was dubbed the ‘ultraviolet catastrophe’.
Credit: IAU OAE/Niall Deacon
License: CC-BY-4.0 Creative Commons Attribution 4.0 International (CC BY 4.0) icons
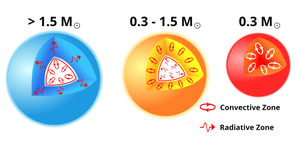
Stellar Structure
Caption: Stars are balls of plasma. For most of a star’s life it burns hydrogen into helium in its core. This phase of a star’s life is known as the main sequence. Burning hydrogen into helium produces heat, that heat travels out of the star’s core eventually reaching the star’s photosphere (often referred to as the “surface” of the star). From here the heat can radiate into space as various forms of electromagnetic radiation. However, how heat travels from the core to the photosphere depends on the star’s mass.
Imagine a parcel of gas rising inside a star. As it rises, it moves into an area of lower pressure, so it cools down and expands. If the parcel is still hotter, and therefore less dense than its surroundings, it keeps moving upward due to buoyancy. Eventually, it will rise far enough to cool and sink back down. This rising and sinking cycle is called convection. Whether convection occurs depends on how quickly temperature changes as you move away from the star’s core. If the temperature in a star drops rapidly, rising parcels of gas are more likely to stay hotter than their surroundings, so convection dominates as the mode of energy transfer in this part of the star. Conversely if the temperature drops more slowly (i.e. if the temperature gradient is small) then heat will mostly be transferred by radiation (photons).
In the most massive main sequence stars (more massive than about 1.5 times the mass of the Sun, seen here on the left), hydrogen is burned into helium using the CNO cycle. This is highly temperature dependent and thus energy production is concentrated near the center of the star. This leads to a larger temperature gradient and thus a convective core. Further out the temperature gradient becomes smaller and heat transport is dominated by radiation. This is called the radiative zone.
For lower mass stars like the Sun (between 0.3 and 1.5 solar masses, seen here in the middle) hydrogen is burned to helium using a different process (the pp chain). This depends less on the internal temperature than the CNO cycle and so energy production is more distributed in the star’s core. This leads to a smaller temperature gradient and thus a radiative core where convection occurs surrounded by a radiative zone. Going further out the gas becomes cool enough for some elements to hang to on some of their electrons, i.e. not being completely ionised. This partially ionised gas is more opaque to photons, trapping heat. This leads to a large temperature gradient and thus convection.
The lowest mass stars (below 0.3 solar masses, seen here on the right) have no radiative zone and are fully convective.
The arrows in the radiative zone are shown as wavy lines heading out of the star. However, a photon’s journey out of a star is much more complex with each individual photon travelling only a short distance before being deflected by some of the charged particles that make up the plasma of the star’s interior. This leads to a long and winding road that takes millennia instead of the few seconds it would take if the photon did not interact with particles in the plasma.
Credit: Based on a vector diagram by Wikimedia user Д.Ильин which itself is based on a diagram from sun.org
License: CC-BY-4.0 Creative Commons Attribution 4.0 International (CC BY 4.0) icons