This page describes an image Hertzsprung-Russell diagram
Download PDF File (PDF file 67.26 kB)
Diagram caption:
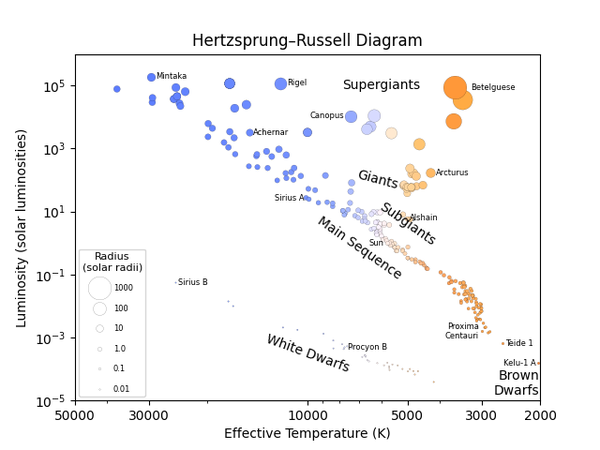
This diagram shows the temperature and luminosity of different stars. The size of each point represents the star’s radius and its colour is the colour the human eye would see. The stars range in colour from a washed-out blue to a washed-out reddish-orange. No star has a pure colour like red, green or blue as stars’ spectra include light from lots of different colours. However the reddest stars are commonly referred to as red and the bluest stars as blue. The sample of stars used to make this diagram was chosen to show a wide range of stars of different types so the relative number of each type of star is not representative of how commonly each type is found.
From the top left to bottom right there is a long line of stars burning hydrogen in their cores. This is called the main sequence. On this line, one sees the stars Mintaka, Achenar, Sirius A, the Sun and Proxima Centauri. The objects around Proxima Centauri at the lower right end of the main sequence are known as red dwarfs. To the lower right of the red dwarfs are Teide 1 and Kelu-1 A. These two objects are brown dwarfs, objects too low in mass to have cores hot enough to fuse hydrogen for a sustained period of time. As they do not burn hydrogen, brown dwarfs are not considered main sequence stars. The name brown dwarf is unrelated to their colour.
Above the main sequence, we find subgiants, giants and supergiants. These are stars that have finished burning hydrogen in their core and have evolved into larger objects. A star’s brightness depends on its temperature and size so giant stars are brighter than stars with a smaller radius but the same temperature. In time these objects will move towards the end of their lives and undergo either a planetary nebula phase or become supernovae. Stars which end their lives with a planetary nebula phase become a type of stellar remnant called a white dwarf. Such objects are much smaller than stars of the same temperature and thus are fainter and are found significantly below the main sequence. Stars which end their lives as supernovae become either black holes or neutron stars. These are not shown on this plot.
Diagram credit: IAU OAE/Niall Deacon.
Diagram translation status: Not yet approved by a reviewer
Related glossary terms:
Brown Dwarf
, Cor
, Effective Temperature
, Estrela gigante
, Hertzsprung–Russell (HR) Diagram
, Luminosity
, Luminosity Class
, Main Sequence
, Stellar Evolution
, Subgiant Star
, Supergiant Star
, White Dwarf
Categories:
Stars
Diagram license: Creative Commons Atribuição 4.0 Internacional (CC BY 4.0) Creative Commons Atribuição 4.0 Internacional (CC BY 4.0) icons
Want to make your own version of this diagram? Then have a look at the code that
produced this diagram on Github
In Other Languages
Inglês: Hertzsprung-Russell diagramFrancês: Diagramme de Hertzsprung-Russell
Chinês Tradicional: 赫羅圖
Chinês Simplificado: 赫罗图
Espanhol: Diagrama Hertzsprung-Russell
Italiano: Diagramma di Hertzsprung-Russell
Want to create your own translation? Then have a look at the code that produced this diagram on Github
The diagram captions presented on the OAE website were written, translated and reviewed by a collective effort from the OAE, the OAE Centers and Nodes, the OAE National Astronomy Education Coordinators (NAECs) and other volunteers. You can find a full list of credits for our translation project here. All media file captions are released under a Creative Commons CC BY-4.0 license and should be credited to "IAU OAE". The media files themselves may have different licenses (see above) and should be credited as listed above under "credit".
If you notice a error in this diagram or its caption then please get in touch.


