This page describes an image Stellar spectral types - bands
Download File ( image 53.91 kB)
Download PDF File (PDF file 26.29 kB)
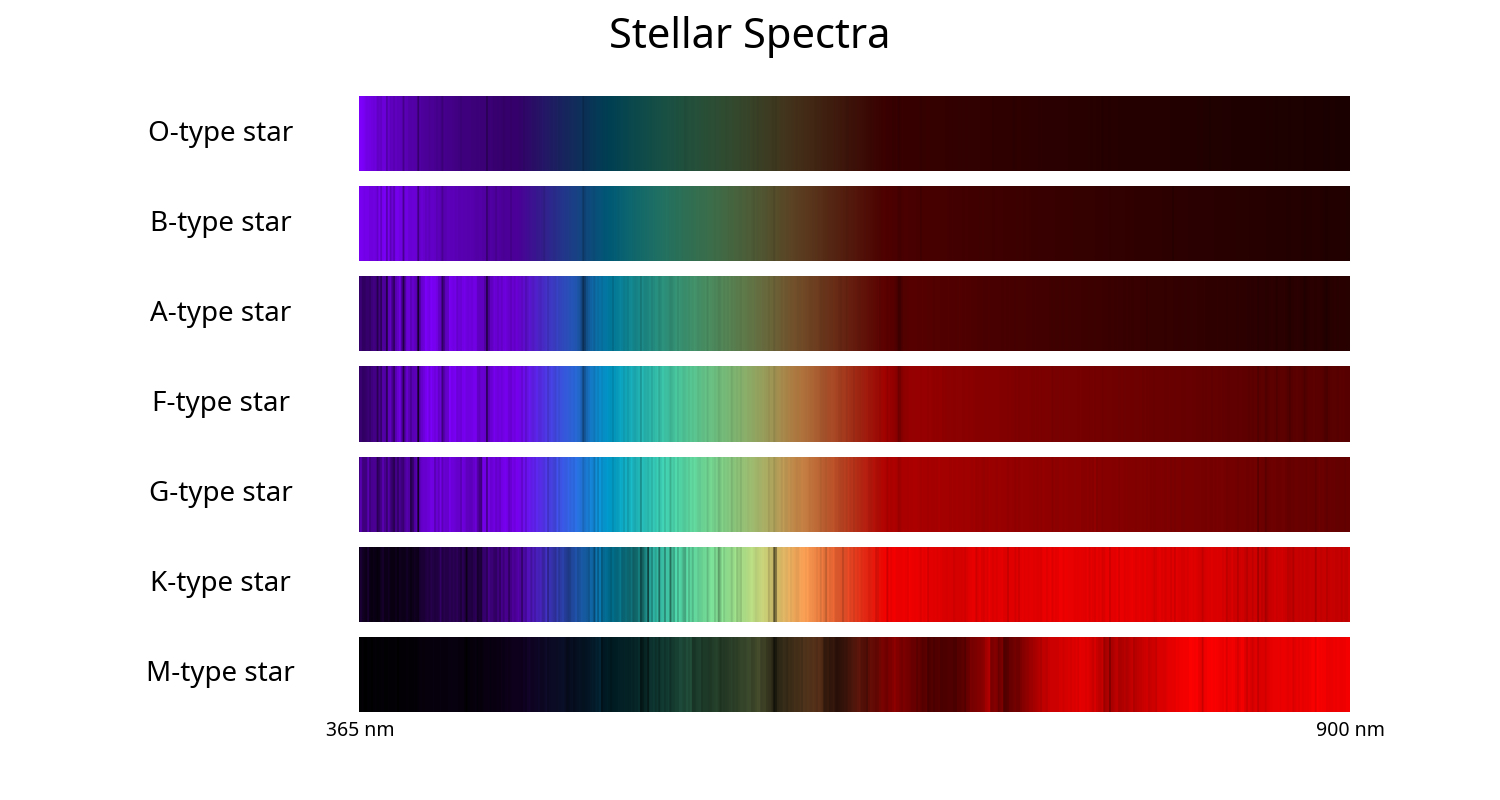
Diagram caption:
The spectra of seven stars ordered by spectral type ranging from the hottest (O-type) at the top to the coolest (M-type at the bottom). The x-axis shows the wavelength of light while the brightness or darkness at each wavelength corresponds to the flux of light received from the star at that wavelength with darker patches having less flux and brighter patches more. Each spectrum is normalized (the flux at each wavelength is divided by the maximum flux for that spectrum) so that the maximum flux should appear with the same brightness for all the spectra. The colour plotted between 400 nm and 700 nm roughly corresponds to the color the human eye would see light of that wavelength. Below 400 nm and above 700 nm, where the human eye can see little to no light, the lines are coloured blue and red respectively.
The hotter stars have more of their flux at the bluer end of the spectrum and the cooler stars have more of their flux at the redder end. However the total amount of flux a star emits depends on its size and temperature. Due to this, a hot star will emit more red light than a cool star of the same size even if the cool star emits almost all its light in red light but this is not visible in this plot due to the normalization mentioned above. The dark, narrow patches in the spectra are absorption lines caused by atoms and ions in the stars’ atmospheres. The strength of a spectral line depends on the temperature of a star’s atmosphere. Take the hydrogen line at 656.5 nm as an example. All of the stars in this plot are primarily made of hydrogen, but the 656.5 nm hydrogen line is weak for the hottest and coolest stars but strongest for spectral types A and F. This is because hydrogen absorbs more light at 656.5 nm at the temperatures of A and F stars’ atmospheres than in hotter or cooler stars.
The coolest star here, the M-type star, has wide absorption bands in its spectra. This is because this star is cool enough to have compounds such as titanium oxide in its atmosphere. These compounds, often called molecules in astronomy, produce wider spectral absorption features than atoms or ions.
Diagram credit: IAU OAE/SDSS/Niall Deacon.
Created with support from: OAE Main Office
Diagram license: Creative Commons Attribution 4.0 International (CC BY 4.0) Creative Commons Attribution 4.0 International (CC BY 4.0) icons
Related glossary terms:
Spectral Type
, Spectrum
, Wavelength
Categories:
Stars
Want to make your own version of this diagram? Then have a look at the code that
produced this diagram on Github
You can also make your own version or translation of this diagram by adding adding text to a version of
this diagram with no text. Just download one of the following files:
Download Text-Free File ( image 17.01 kB)
Download Text-Free PDF File (PDF file 15.49 kB)
Linked Diagrams
Spectrum of an O-type starSpectrum of a B-type star
Spectrum of an A-type star
Spectrum of an F-type star
Spectrum of a G-type star
Spectrum of a K-type star
Spectrum of an M-type star
Stellar spectral types
In Other Languages
Italian: Tipi spettrali stellari - bandeFrench: Types spectraux stellaires - bandes
Spanish: Tipos espectrales estelares - bandas
Arabic: الأنواع الطيفية النجمية - النطاقات
Traditional Chinese: 恒星光譜類型 - 波段
Simplified Chinese: 恒星光谱类型 - 波段
The diagram captions presented on the OAE website were written, translated and reviewed by a collective effort from the OAE, the OAE Centers and Nodes, the OAE National Astronomy Education Coordinators (NAECs) and other volunteers. You can find a full list of credits for our translation project here. All media file captions are released under a Creative Commons CC BY-4.0 license and should be credited to "IAU OAE". The media files themselves may have different licenses (see above) and should be credited as listed above under "credit".
If you notice a error in this diagram or its caption then please get in touch.

