Glossary term: Spectral Type
Description: Stars are classified into spectral types according to the appearance of features in their spectra.
For most stars, the spectral type is based primarily on the temperature of the stellar surface and follows a sequence: O, B, A, F, G, K, and M, listed from hottest to coldest. This sequence has recently been extended to the cooler types L, T, and Y. These three represent mostly brown dwarfs, but some objects with spectral type L are stars rather than brown dwarfs.
There are also letters to classify special classes of star. Carbon stars are stars with strong spectral features from molecules containing carbon. These are classified as type C. S-type stars are intermediate between types K or M and C in that the surface abundances of oxygen and carbon are nearly equal. White dwarfs are divided into a series of different types based on features in their spectra; all these types begin with the letter D (DA, DB, etc.). Hot, massive stars with broad emission lines have a series of types beginning with W (WN, WC, WO).
The present notation is a legacy from the first modern classification attempt, undertaken at Harvard College Observatory. The classes, originally designated A–Q, alphabetically, were subsequently reordered as a temperature sequence, resulting in the main types still used today. The main spectral classes are subdivided, denoted by the numbers from zero to nine. The Sun is spectral type G2. Additional letters refer to special characteristics (such as e for stars with bright emission lines), and the luminosity class, denoted by Roman numerals, may also be specified.
Related Terms:
- A-type Star
- B-type Star
- F-type Star
- K-type Star
- Spectrum
- Star
- Sun
- G-type Star
- M-type Star
- O-type Star
- Luminosity Class
See this term in other languages
Term and definition status: This term and its definition have been approved by a research astronomer and a teacher
The OAE Multilingual Glossary is a project of the IAU Office of Astronomy for Education (OAE) in collaboration with the IAU Office of Astronomy Outreach (OAO). The terms and definitions were chosen, written and reviewed by a collective effort from the OAE, the OAE Centers and Nodes, the OAE National Astronomy Education Coordinators (NAECs) and other volunteers. You can find a full list of credits here. All glossary terms and their definitions are released under a Creative Commons CC BY-4.0 license and should be credited to "IAU OAE".
If you notice a factual error in this glossary definition then please get in touch.
In Other Languages
- Arabic: النوع الطيفي
- German: Spektralklasse
- French: Type spectral
- Italian: Tipo spettrale
- Japanese: スペクトル型(星の) (external link)
- Brazilian Portuguese: Tipo espectral
- Simplified Chinese: 光谱类型
- Traditional Chinese: 光譜類型
Related Diagrams
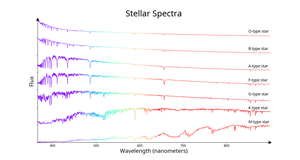
Stellar spectral types
Caption: The spectra of seven stars ordered by spectral type ranging from the hottest (O-type) at the top to the coolest (M-type at the bottom). The x-axis shows the wavelength of light and the y-axis is a measure of the flux of light received at that wavelength. Each spectrum is normalized (the flux at each wavelength is divided by the maximum flux in that spectrum) and the spectra are then offset from each other along the y-axis to make the plot easier to view. The colour of the lines between 400 nm and 700 nm roughly corresponds to the colour the human eye would see light of that wavelength. Below 400 nm and above 700 nm, where the human eye can see little to no light, the lines are coloured blue and red respectively.
The hotter stars have more of their flux at the bluer end of the spectrum and the cooler stars have more of their flux at the redder end. However the total amount of flux a star emits depends on its size and temperature. Due to this, a hot star will emit more red light than a cool star of the same size even if the cool star emits almost all its light in red light but this is not visible in this plot due to the normalization mentioned above. The sharp, narrow drops in the spectra are absorption lines caused by atoms and ions in the stars’ atmospheres. The strength of a spectral line depends on the temperature of a star’s atmosphere. Take the hydrogen line at 656.5 nm as an example. All of the stars in this plot are primarily made of hydrogen, but the 656.5 nm hydrogen line is weak for the hottest and coolest stars but strongest for spectral types A and F. This is because hydrogen absorbs more light at 656.5 nm at the temperatures of A and F stars’ atmospheres than in hotter or cooler stars.
The coolest star here, the M-type star, has wide absorption bands in its spectra. This is because this star is cool enough to have compounds such as titanium oxide in its atmosphere. These compounds, often called molecules in astronomy, produce wider spectral absorption features than atoms or ions.
Credit: IAU OAE/SDSS/Niall Deacon
License: CC-BY-4.0 Creative Commons Attribution 4.0 International (CC BY 4.0) icons
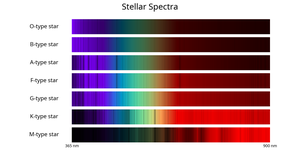
Stellar spectral types - bands
Caption: The spectra of seven stars ordered by spectral type ranging from the hottest (O-type) at the top to the coolest (M-type at the bottom). The x-axis shows the wavelength of light while the brightness or darkness at each wavelength corresponds to the flux of light received from the star at that wavelength with darker patches having less flux and brighter patches more. Each spectrum is normalized (the flux at each wavelength is divided by the maximum flux for that spectrum) so that the maximum flux should appear with the same brightness for all the spectra. The colour plotted between 400 nm and 700 nm roughly corresponds to the color the human eye would see light of that wavelength. Below 400 nm and above 700 nm, where the human eye can see little to no light, the lines are coloured blue and red respectively.
The hotter stars have more of their flux at the bluer end of the spectrum and the cooler stars have more of their flux at the redder end. However the total amount of flux a star emits depends on its size and temperature. Due to this, a hot star will emit more red light than a cool star of the same size even if the cool star emits almost all its light in red light but this is not visible in this plot due to the normalization mentioned above. The dark, narrow patches in the spectra are absorption lines caused by atoms and ions in the stars’ atmospheres. The strength of a spectral line depends on the temperature of a star’s atmosphere. Take the hydrogen line at 656.5 nm as an example. All of the stars in this plot are primarily made of hydrogen, but the 656.5 nm hydrogen line is weak for the hottest and coolest stars but strongest for spectral types A and F. This is because hydrogen absorbs more light at 656.5 nm at the temperatures of A and F stars’ atmospheres than in hotter or cooler stars.
The coolest star here, the M-type star, has wide absorption bands in its spectra. This is because this star is cool enough to have compounds such as titanium oxide in its atmosphere. These compounds, often called molecules in astronomy, produce wider spectral absorption features than atoms or ions.
Credit: IAU OAE/SDSS/Niall Deacon
License: CC-BY-4.0 Creative Commons Attribution 4.0 International (CC BY 4.0) icons