This page describes an image 黑体辐射--紫外线灾难
下载文件 ( 图像 88.56 kB)
下载 PDF 文件 (PDF file 36.49 kB)
图示说明:
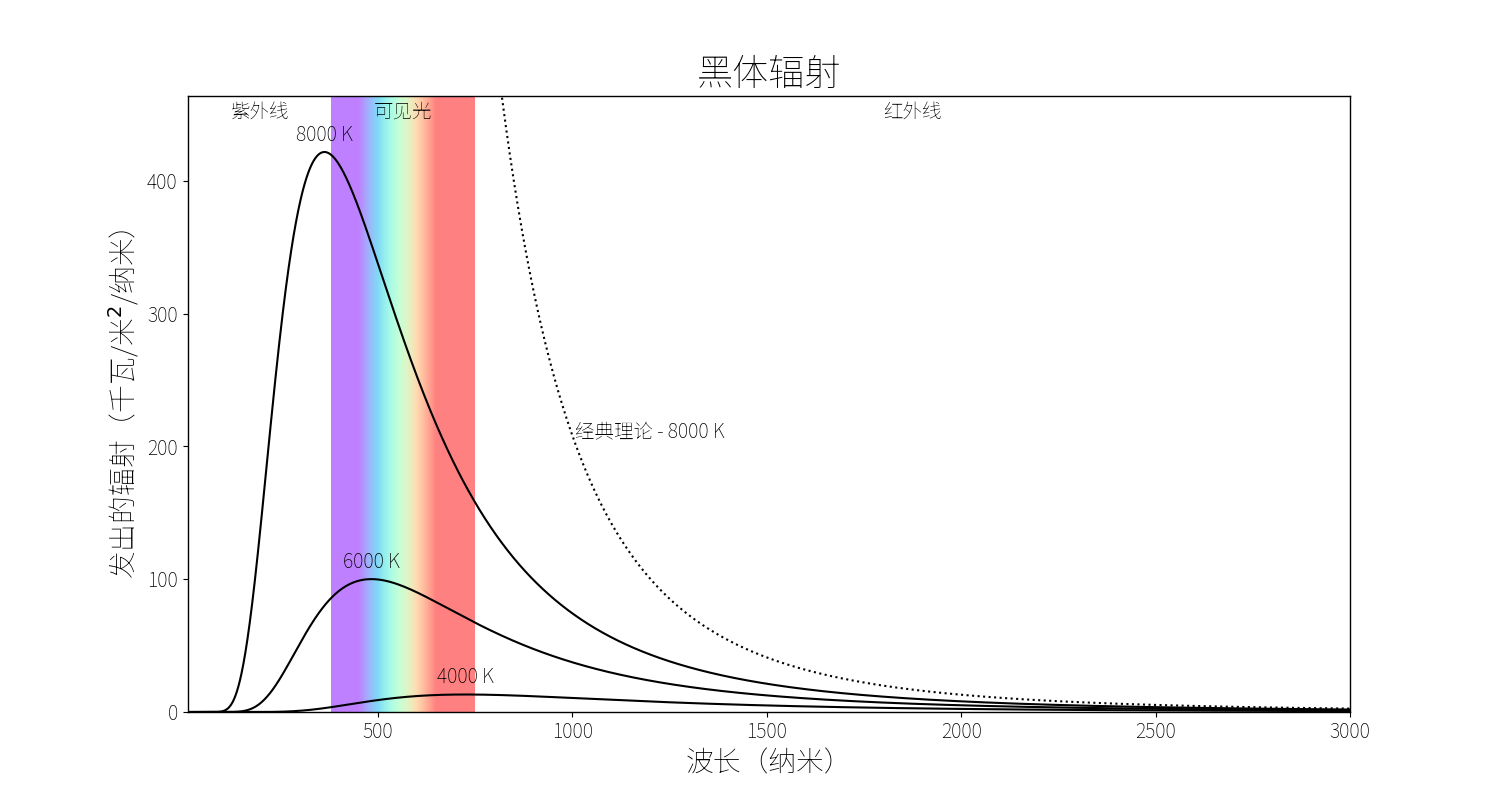
不同温度黑体的辐射曲线。x 轴表示波长,y 轴表示黑体表面每平方米在每个波长下每秒发射的能量。
温度越高的物体,波长越短,发出的最大能量光也越蓝。尽管图中最冷的天体发出的红光达到峰值,但其他较热的天体发出的红光都比最冷的天体多。
虚线显示的是现代量子力学之前的经典理论所预测的辐射量。对于任何温度高于零的黑体,这一预测在较短波长处都趋于无穷大,被称为 "紫外线灾难"。
图示来源: IAU OAE/Niall Deacon.
图示翻译状态: 尚未由审核人员批准
图示译者: Bao Lizhuo
由以下机构支持制作: OAE Main Office
图示授权许可: 知识共享许可协议 署名 4.0 国际 (CC BY 4.0) 知识共享许可协议 署名 4.0 国际 (CC BY 4.0) 图标
相关术语表词条:
波长
, 电磁辐射
, 黑体辐射
分类:
物理学
想制作该图示的自定义版本?您可以在Github上查看生成该图示的源代码。
You can also make your own version or translation of this diagram by adding adding text to a version of
this diagram with no text. Just download one of the following files:
Download Text-Free File ( 图像 60.81 kB)
Download Text-Free PDF File (PDF file 10.86 kB)
相关图示
黑体辐射其他语言版本
英语: Blackbody Radiation - UV Catastrophe德语: Schwarzkörperstrahlung - UV-Katastrophe
巴西葡萄牙语: Radiação de corpo negro - Catástrofe do UV
意大利语: Radiazione di corpo nero - Catastrofe UV
法语: Rayonnement du corps noir - Catastrophe UV
阿拉伯语: إشعاع الجسم الأسود - كارثة الأشعة فوق البنفسجية
马拉地语: कृष्णिका प्रारण अतिनील आपत्ती
繁体中文: 黑體輻射--紫外綫災難
西班牙语: Radiación de cuerpo negro - Catástrofe UV
波斯语: تابش جسم سیاه - فاجعه فرابنفش
尼泊尔语: ब्ल्याक बडी रेडिएशन पराबैंगनी विपत्ति/संकट
The diagram captions presented on the OAE website were written, translated and reviewed by a collective effort from the OAE, the OAE Centers and Nodes, the OAE National Astronomy Education Coordinators (NAECs) and other volunteers. You can find a full list of credits for our translation project here. All media file captions are released under a Creative Commons CC BY-4.0 license and should be credited to "IAU OAE". The media files themselves may have different licenses (see above) and should be credited as listed above under "credit".
If you notice a error in this diagram or its caption then please get in touch.

