بلغات أخرى
- الألمانيّة: Astrophysik
- الإنجليزيّة: Astrophysics
- الإسبانيّة: Astrofísica
- الفرنسيّة: Astrophysique
- الإيطاليّة: Astrofisica
- الكوريّة: 천체물리학
- البرتغاليّة البرازيليّة: Astrofísica
- الصينيّة المبسطة: 天体物理学
- الصينيّة التقليدية: 天體物理學
وسائط ذات صلة
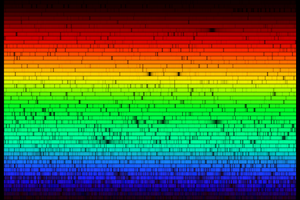
Solar absorption lines
الشرح: This is a high resolution spectrum of light from our Sun showing visible region of the electromagnetic spectrum. The absorption lines are visible clearly as narrow black regions. The visualization shown here was created to mimic a so-called echelle spectrum, with wavelength increasing from left to right along each strip, and from bottom to top. Each of the 50 horizontal strips covers 6 nanometers, for a complete spectrum across the visible range from 400 to 700 nanometers.
This spectrum was created from a digital atlas observed with the Fourier Transform Spectrometer at the McMath-Pierce Solar Facility at the National Solar Observatory on Kitt Peak, near Tucson, Arizona (‘Solar Flux Atlas from 296 to 1300 nm" by Robert L. Kurucz, Ingemar Furenlid, James Brault, and Larry Testerman: National Solar Observatory Atlas No. 1, June 1984).
Note: NSO/Kitt Peak FTS data used here were produced by NSF/NOAO.
المصدر: N.A. Sharp/KPNO/NOIRLab/NSO/NSF/AURA
رابط المصدر
License: CC-BY-4.0 المشاع الإبداعي نَسب المُصنَّف 4.0 دولي (CC BY 4.0) أيقونات