Glossary term: Calentamiento global
Description: El calentamiento global es el aumento de la temperatura de la atmósfera de un planeta debido a los gases de efecto invernadero, como las moléculas de agua, el dióxido de carbono, el metano, etc. Esto se debe a un aumento del efecto invernadero, por el que la atmósfera retiene una mayor cantidad de radiación infrarroja, lo que provoca un aumento de la temperatura media global del planeta. Las fuentes de gases de efecto invernadero pueden ser naturales o (en la Tierra) estar provocadas además por la actividad industrial humana. El calentamiento global en la Tierra tendrá efectos significativos a muy largo plazo en el planeta, incluyendo cambios a corto y medio plazo en los patrones climáticos locales, la destrucción de hábitats y el aumento del nivel del mar.
Related Terms:
See this term in other languages
Term and definition status: The original definition of this term in English have been approved by a research astronomer and a teacher The translation of this term and its definition is still awaiting approval
The OAE Multilingual Glossary is a project of the IAU Office of Astronomy for Education (OAE) in collaboration with the IAU Office of Astronomy Outreach (OAO). The terms and definitions were chosen, written and reviewed by a collective effort from the OAE, the OAE Centers and Nodes, the OAE National Astronomy Education Coordinators (NAECs) and other volunteers. You can find a full list of credits here. All glossary terms and their definitions are released under a Creative Commons CC BY-4.0 license and should be credited to "IAU OAE".
If you notice a factual or translation error in this glossary term or definition then please get in touch.
In Other Languages
- Árabe: الإحتباس الحرارى
- Alemán: Globale Erwärmung
- Inglés: Global Warming
- Francés: Réchauffement climatique
- Italiano: Riscaldamento globale
- Japonés: 地球温暖化 (external link)
- Coreano: 전지구온난화
- Portugués de Brasil: Aquecimento global
- Chino simplificado: 全球气候变暖
- Chino tradicional: 全球氣候變暖
Related Media

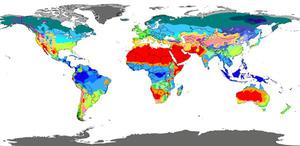
Global Temperature Trends: Past 50 Years
Caption: This map visualizes the changes in surface air temperature across the globe over the past half-century. Through meticulous analysis of annual averages, the map highlights the most significant trends in temperature change, particularly emphasizing shifts in northern latitudes and over land masses.
Credit: NASA’s Scientific Visualization Studio, Key and Title by Eric Fisk
credit link
License: CC-BY-4.0 Creative Commons Reconocimiento 4.0 Internacional (CC BY 4.0) icons
Related Activities
Continental Climate and Oceanic Climate
astroEDU educational activity (links to astroEDU website) Description: Find out why, in the summer it is cooler by the sea than on the land!
License: CC-BY-4.0 Creative Commons Reconocimiento 4.0 Internacional (CC BY 4.0) icons
Tags:
Climate change
, Climate
, Ocean
Age Ranges:
6-8
, 8-10
Education Level:
Primary
Areas of Learning:
Modelling
, Structured-inquiry learning
, Traditional Science Experiment
Costs:
Medium Cost
Duration:
45 mins
Group Size:
Group
Skills:
Analysing and interpreting data
, Asking questions
, Constructing explanations
, Engaging in argument from evidence
, Planning and carrying out investigations
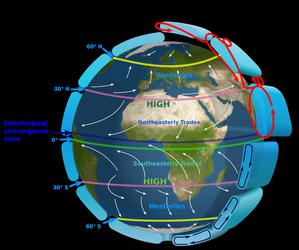
The Intertropical Convergence Zone
astroEDU educational activity (links to astroEDU website) Description: The air circulation system: how are winds created?
License: CC-BY-4.0 Creative Commons Reconocimiento 4.0 Internacional (CC BY 4.0) icons
Tags:
Climate
, Updraft
, Convection
, Winds
Age Ranges:
12-14
, 14-16
Education Level:
Middle School
Areas of Learning:
Discussion Groups
, Modelling
, Structured-inquiry learning
Costs:
Medium Cost
Duration:
1 hour
Group Size:
Group
Skills:
Communicating information
, Constructing explanations
, Developing and using models
, Engaging in argument from evidence
, Planning and carrying out investigations
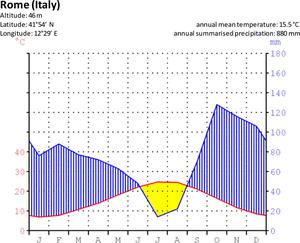
The Climate in Numbers and Graphs
astroEDU educational activity (links to astroEDU website) Description: Learn about climate from data and graphs
License: CC-BY-4.0 Creative Commons Reconocimiento 4.0 Internacional (CC BY 4.0) icons
Tags:
Climate
, Average
, Climate zone
, Weather
Age Ranges:
14-16
, 16-19
Education Level:
Secondary
Areas of Learning:
Structured-inquiry learning
Costs:
Low Cost
Duration:
2 hours
Group Size:
Group
Skills:
Analysing and interpreting data
, Asking questions
, Communicating information
, Constructing explanations
, Developing and using models
, Engaging in argument from evidence
, Using mathematics and computational thinking

Oceans As A Heat Reservoir
astroEDU educational activity (links to astroEDU website) Description: Why do oceans play an important role in mitigating global warming?
License: CC-BY-4.0 Creative Commons Reconocimiento 4.0 Internacional (CC BY 4.0) icons
Tags:
Life
, Climate change
, Oceans
, heat
Age Ranges:
12-14
, 14-16
, 16-19
Education Level:
Middle School
Areas of Learning:
Modelling
, Structured-inquiry learning
, Traditional Science Experiment
Costs:
Medium Cost
Duration:
1 hour 30 mins
Group Size:
Group
Skills:
Analysing and interpreting data
, Constructing explanations
, Developing and using models
, Engaging in argument from evidence
, Planning and carrying out investigations

The Big Meltdown
astroEDU educational activity (links to astroEDU website) Description: Learn what would happen on Earth if all the ice melted!
License: CC-BY-4.0 Creative Commons Reconocimiento 4.0 Internacional (CC BY 4.0) icons
Tags:
Life
, Climate change
, Remote sensing
, Oceans
, Water
, Antarctic
, Arctic
, Ice
, Archimedes
Age Ranges:
8-10
, 10-12
, 12-14
Education Level:
Middle School
, Primary
, Secondary
Areas of Learning:
Discussion Groups
, Modelling
, Structured-inquiry learning
, Traditional Science Experiment
Costs:
Medium Cost
Duration:
45 mins
Group Size:
Group
Skills:
Analysing and interpreting data
, Asking questions
, Communicating information
, Constructing explanations
, Developing and using models
, Engaging in argument from evidence
, Planning and carrying out investigations