Termo do glossário: Espectro
Descrição: Um arco-íris se forma quando gotículas de água dividem a luz em cores elementares: violeta, azul, verde, amarelo, laranja e vermelho. Cada cor corresponde a uma faixa de comprimentos de onda, e as cores do arco-íris estão dispostas em ordem crescente de comprimento de onda, do violeta ao vermelho. Esse tipo de decomposição da luz — ou da radiação eletromagnética em geral — em diferentes comprimentos de onda é chamado de espectro.
A radiação eletromagnética é uma mistura de partículas de luz chamadas “fótons”. Criar um espectro equivale a classificar os fótons por energia e registrar quantos fótons existem em cada faixa de energia específica. De acordo com uma lei básica da mecânica quântica, isso equivale a classificar a luz por frequência – mais uma maneira de documentar um espectro.
Se a quantidade de energia varia suavemente com o comprimento de onda (ou energia do fóton, ou frequência), o espectro é chamado de contínuo. Em contrapartida, quedas ou picos acentuados em um espectro em determinados comprimentos de onda são chamados de linhas de absorção e de emissão, respectivamente. Tais linhas surgem devido a transições entre diferentes níveis de energia dentro de átomos ou moléculas (ou mesmo núcleos atômicos), que absorvem ou emitem radiação em comprimentos de onda específicos. Por exemplo, na luz visível, as estrelas apresentam espectros contínuos com linhas de absorção. Essas linhas contêm informações sobre a composição química de uma estrela. A análise de espectros é conhecida como espectroscopia; os instrumentos que permitem o registro de espectros são chamados de espectroscópios, espectrômetros ou espectrógrafos.
Termos relacionados:
Ver este termo em outros idiomas
Status do termo e da definição: A definição original deste termo em inglês foi aprovada por um astrônomo(a) pesquisador(a) e um(a) professor(a) A tradução deste termo e de sua definição ainda aguarda aprovação
O Glossário Multilíngue da OAE é um projeto do Escritório da IAU de Astronomia para a Educação (OAE) em colaboração com o Escritório da IAU para Divulgação da Astronomia (OAO). Os termos e definições foram selecionados, escritos e revisados por meio de um esforço coletivo da OAE, dos Centros e Nós da OAE, dos Coordenadores Nacionais de Educação em Astronomia (NAECs) da OAE e de outros voluntários. Você pode encontrar uma lista completa dos créditos aqui. Todos os termos do glossário e suas definições são disponibilizados sob uma licença Creative Commons CC BY-4.0 e devem ser creditados à "IAU OAE".
Se você notar algum erro factual ou de tradução neste termo do glossário ou em sua definição, por favor entre em contato.
Mídia relacionada
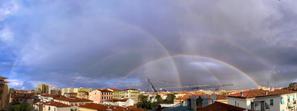
24 Hours of Rainbow
Legenda: Honorable mention in the 2023 IAU OAE Astrophotography Contest, category of Still images taken exclusively with smartphones/mobile devices.
This panoramic view taken with a smartphone of Livorno, Italy, showcases a series of vivid rainbows captured on three different days in December 2021. Rainbows are the result of sunlight being refracted by water droplets suspended in the air, typically after rainfall or during misty conditions. The water droplets act like a prism, breaking up (refracting) the sunlight into the various colours. The different wavelengths of light are refracted by different amounts, which is why we see this layering of colours. The photographer skillfully merged the most remarkable shots taken on different days to highlight the diverse sizes and brilliance of these rainbows. The locations at which the rainbows appear to be centred are different because each rainbow appeared when the Sun was at a different position in the sky. This composite image beautifully captures the transient yet mesmerising allure of rainbows, illustrating their fleeting appearance and gradual dissipation influenced by the shifting atmospheric conditions.
Crédito: Fabrizio Guasconi/IAU OAE (CC BY 4.0)
License: CC-BY-4.0 Creative Commons Attribution 4.0 International (CC BY 4.0) ícones
Diagramas relacionados
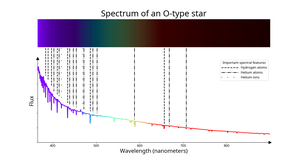
Spectrum of an O-type star
Legenda: The spectrum of the O-type star HD 235673 with wavelength in nanometers on the x-axis and flux on the y-axis. The top part of the plot shows the same spectrum but with bright patches for wavelengths with high flux and dark patches for wavelengths with low flux. The colour of the line between 400 nm and 700 nm roughly corresponds to the colour the human eye would see light of that wavelength. Below 400 nm and above 700 nm, where the human eye can see little to no light, the lines are coloured blue and red respectively.
The black lines show spectral absorption lines caused by atoms and ions of different elements in the star’s atmosphere. These atoms and ions absorb at specific wavelengths, causing sharp, dark lines in the spectra. How strong these lines are depends on the temperature of the star’s atmosphere. Two stars made from the same mix of elements could have spectra with vastly different sets of lines in their spectra if they have different temperatures in their atmospheres. For O-type stars the most important features are a small number of lines caused by ionized helium. These lines are stronger in O-type stars than in cooler stars. Lines from helium atoms and hydrogen atoms also appear in the spectrum. The spectrum has more flux at the blue end of the spectrum than at the red end of the spectrum.
Crédito: IAU OAE/SDSS/Niall Deacon
License: CC-BY-4.0 Creative Commons Attribution 4.0 International (CC BY 4.0) ícones
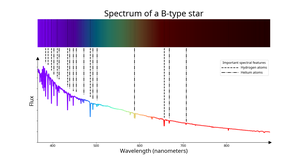
Spectrum of a B-type star
Legenda: The spectrum of the B-type star HD 258982. The colour of the line between 400 nm and 700 nm roughly corresponds to the colour the human eye would see light of that wavelength. Below 400 nm and above 700 nm, where the human eye can see little to no light, the lines are coloured blue and red respectively.
The black lines show spectral absorption lines caused by atoms and ions of different elements in the star’s atmosphere. These atoms and ions absorb at specific wavelengths, causing sharp, dark lines in the spectra. How strong these lines are depends on the temperature of the star’s atmosphere. Two stars made from the same mix of elements could have spectra with vastly different sets of lines in their spectra if they have different temperatures in their atmospheres. For B-type stars the most important lines are caused by helium atoms. These lines are strongest in B-type stars and weaker in hotter and cooler types. Lines from hydrogen atoms are also present but are not as strong as in cooler A-type stars.
Crédito: IAU OAE/SDSS/Niall Deacon
License: CC-BY-4.0 Creative Commons Attribution 4.0 International (CC BY 4.0) ícones
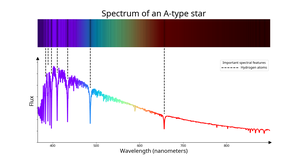
Spectrum of an A-type star
Legenda: The spectrum of the A-type star BD-11 1212. The colour of the line between 400 nm and 700 nm roughly corresponds to the colour the human eye would see light of that wavelength. Below 400 nm and above 700 nm, where the human eye can see little to no light, the lines are coloured blue and red respectively.
The black lines show spectral absorption lines caused by atoms and ions of different elements in the star’s atmosphere. These atoms and ions absorb at specific wavelengths, causing sharp, dark lines in the spectra. How strong these lines are depends on the temperature of the star’s atmosphere. Two stars made from the same mix of elements could have spectra with vastly different sets of lines in their spectra if they have different temperatures in their atmospheres. Lines from hydrogen atoms dominate the spectra of A-type stars and are strongest at this spectral type.
Crédito: IAU OAE/SDSS/Niall Deacon
License: CC-BY-4.0 Creative Commons Attribution 4.0 International (CC BY 4.0) ícones
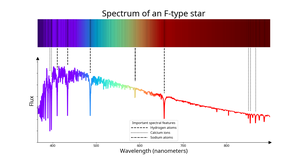
Spectrum of an F-type star
Legenda: The spectrum of the F-type star 2MASS J22243289+4937443. The colour of the line between 400 nm and 700 nm roughly corresponds to the colour the human eye would see light of that wavelength. Below 400 nm and above 700 nm, where the human eye can see little to no light, the lines are coloured blue and red respectively.
The black lines show spectral absorption lines caused by atoms and ions of different elements in the star’s atmosphere. These atoms and ions absorb at specific wavelengths, causing sharp, dark lines in the spectra. How strong these lines are depends on the temperature of the star’s atmosphere. Two stars made from the same mix of elements could have spectra with vastly different sets of lines in their spectra if they have different temperatures in their atmospheres. The lines from hydrogen atoms that are strongest in A-type stars are still relatively strong in F-type stars but lines from metals, particularly ionised calcium begin to become strong at this spectral type.
Crédito: IAU OAE/SDSS/Niall Deacon
License: CC-BY-4.0 Creative Commons Attribution 4.0 International (CC BY 4.0) ícones
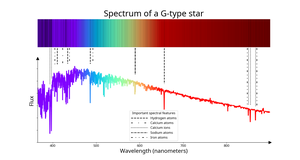
Spectrum of a G-type star
Legenda: The spectrum of the G-type star UCAC4 700-069569. The colour of the line between 400 nm and 700 nm roughly corresponds to the colour the human eye would see light of that wavelength. Below 400 nm and above 700 nm, where the human eye can see little to no light, the lines are coloured blue and red respectively.
The black lines show spectral absorption lines caused by atoms and ions of different elements in the star’s atmosphere. These atoms and ions absorb at specific wavelengths, causing sharp, dark lines in the spectra. How strong these lines are depends on the temperature of the star’s atmosphere. Two stars made from the same mix of elements could have spectra with vastly different sets of lines in their spectra if they have different temperatures in their atmospheres. In G-type stars lines from hydrogen atoms are weaker than in F-type stars and lines from ionised calcium stronger. Lines from metal atoms such as atoms of iron, sodium and calcium also begin to become prominent.
Crédito: IAU OAE/SDSS/Niall Deacon
License: CC-BY-4.0 Creative Commons Attribution 4.0 International (CC BY 4.0) ícones
Atividades relacionadas
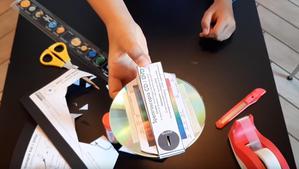
Hunting for spectra
astroEDU educational activity (links to astroEDU website) Description: Learn about light and spectra building a spectroscope with a CD!
License: CC-BY-4.0 Creative Commons Attribution 4.0 International (CC BY 4.0) ícones
Tags:
Hands-on
, Experiment
, prism
Faixas etárias:
8-10
, 10-12
, 12-14
, 14-16
, 16-19
Nível de ensino:
Informal
, Ensino fundamental
, Básico
, Médio
Áreas de aprendizagem:
Aprendizagem por descoberta guiada
Custos:
Baixo custo
Duração:
1 hour
Tamanho do grupo:
Individual
Habilidades:
Fazer perguntas
, Construir explicações
, Planejar e realizar pesquisas
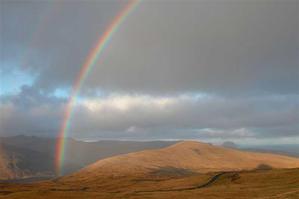
Reading the Rainbow
astroEDU educational activity (links to astroEDU website) Description: By understanding how rainbows work, you can discover about light and its properties, learning about stars, nebulae, galaxies, and our Universe.
License: CC-BY-4.0 Creative Commons Attribution 4.0 International (CC BY 4.0) ícones
Faixas etárias:
14-16
, 16-19
, 19+
Nível de ensino:
Informal
, Ensino fundamental
, Médio
, Universidade
Áreas de aprendizagem:
Aula interativa
, Baseado em observação
, Aprendizagem por investigação estruturada
Custos:
Baixo custo
Duração:
1 hour 30 mins
Tamanho do grupo:
Grupo
Habilidades:
Analisar e interpretar dados
, Fazer perguntas
, Engajar-se em argumentação com base em evidências
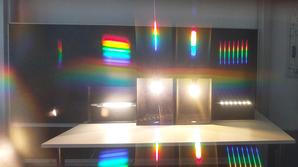
Find the hidden rainbows
astroEDU educational activity (links to astroEDU website) Description: Let’s reveal hidden rainbows around us and the physical processes that make them!
License: CC-BY-4.0 Creative Commons Attribution 4.0 International (CC BY 4.0) ícones
Faixas etárias:
10-12
, 12-14
, 14-16
Nível de ensino:
Ensino fundamental
, Médio
Áreas de aprendizagem:
Aula interativa
, Baseado em observação
, Aprendizagem por investigação estruturada
Custos:
Custo médio
Duração:
1 hour