Glossary term: Blackbody Radiation
Description: Blackbody radiation is electromagnetic radiation from an idealized object (blackbody) that absorbs all radiation that falls on it and re-emits it at a rate that maintains a state of thermal equilibrium. The spectrum of blackbody radiation is completely specified by the body's temperature according to known laws. Most stars emit light similar to that of a blackbody at a temperature of several thousand kelvins. To be contrasted with synchrotron radiation and other forms of "non-thermal" radiation.
See this term in other languagesTerm and definition status: This term and its definition have been approved by a research astronomer and a teacher
The OAE Multilingual Glossary is a project of the IAU Office of Astronomy for Education (OAE) in collaboration with the IAU Office of Astronomy Outreach (OAO). The terms and definitions were chosen, written and reviewed by a collective effort from the OAE, the OAE Centers and Nodes, the OAE National Astronomy Education Coordinators (NAECs) and other volunteers. You can find a full list of credits here. All glossary terms and their definitions are released under a Creative Commons CC BY-4.0 license and should be credited to "IAU OAE".
If you notice a factual error in this glossary definition then please get in touch.
In Other Languages
- Arabic: إشعاع الجسم الأسود
- German: Schwarzkörperstrahlung
- Spanish: Radiación de cuerpo negro
- French: Rayonnement du Corps noir
- Italian: Radiazione di corpo nero
- Japanese: 黒体放射 (external link)
- Korean: 흑체복사
- Marathi: कृष्णिका प्रारण
- Brazilian Portuguese: Radiação do corpo negro
- Simplified Chinese: 黑体辐射
- Traditional Chinese: 黑體輻射
Related Diagrams
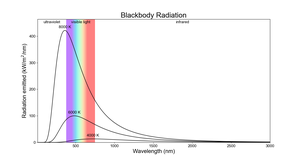
Blackbody Radiation
Caption: The curves of emitted radiation from blackbodies of different temperatures. The x-axis shows wavelength and the y-axis shows the amount of energy emitted every second by a square meter of the surface of that blackbody at each wavelength.
The hotter the body, the shorter the wavelength and the bluer the light it emits its maximum amount of energy at. Despite the coolest body in this plot peaking in red light, the other hotter bodies all emit more red light than the coolest body.
Credit: IAU OAE/Niall Deacon
License: CC-BY-4.0 Creative Commons Attribution 4.0 International (CC BY 4.0) icons
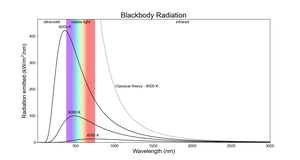
Blackbody Radiation - UV Catastrophe
Caption: The curves of emitted radiation from blackbodies of different temperatures. The x-axis shows wavelength and the y-axis shows the amount of energy emitted every second by a square meter of the surface of that blackbody at each wavelength.
The hotter the body, the shorter the wavelength and the bluer the light it emits its maximum amount of energy at. Despite the coolest body in this plot peaking in red light, the other hotter bodies all emit more red light than the coolest body.
The dotted line shows the emitted radiation predicted by classical theory prior to modern quantum mechanics. This prediction tends to infinity at shorter wavelengths for any blackbody temperature above zero and was dubbed the ‘ultraviolet catastrophe’.
Credit: IAU OAE/Niall Deacon
License: CC-BY-4.0 Creative Commons Attribution 4.0 International (CC BY 4.0) icons