This page describes an image Stellar spectral types
Datei runterladen ( Bild 185.71 kB)
PDF Datei runterladen (PDF file 393.16 kB)
Untertitel Diagramm:
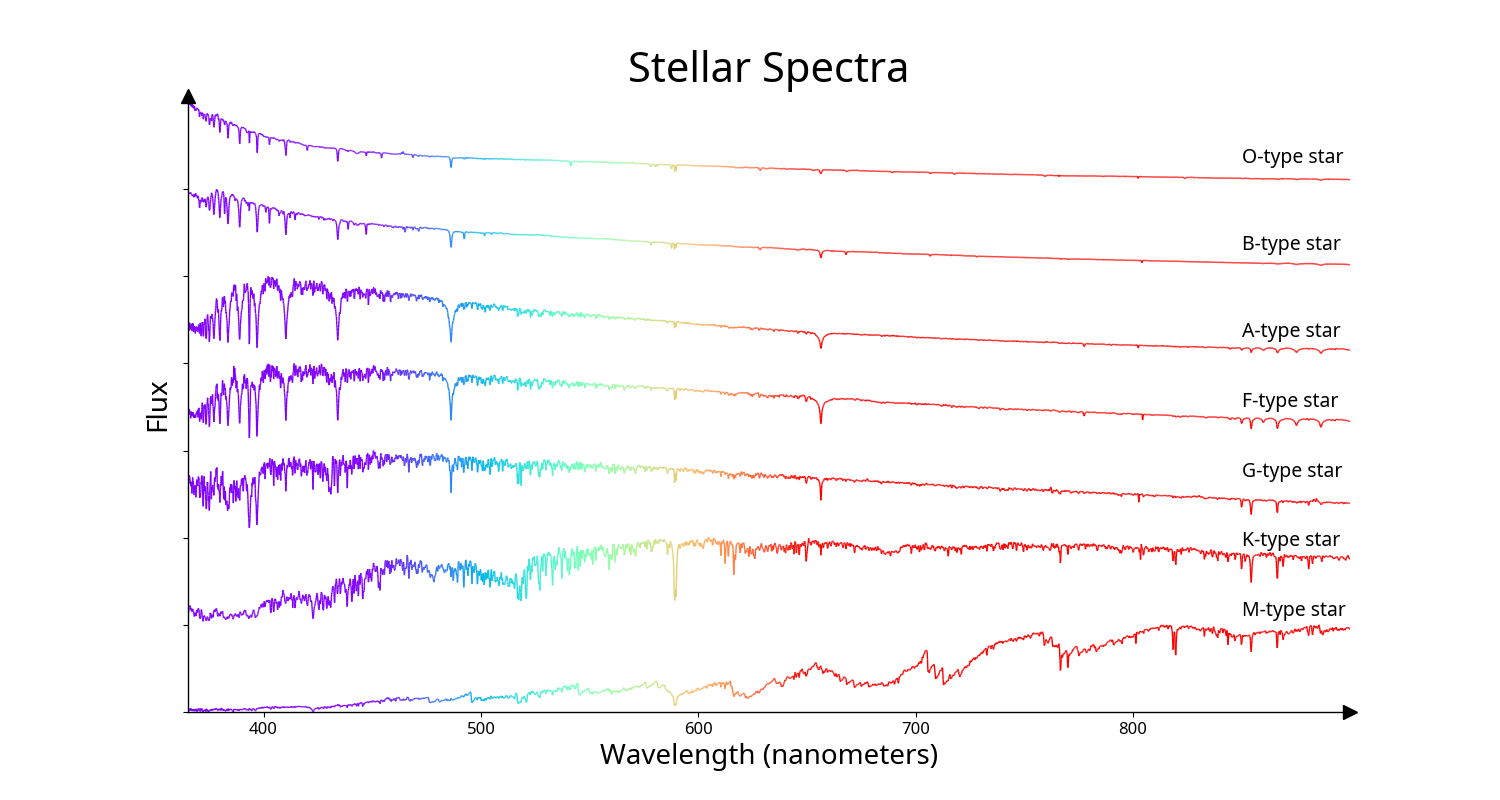
The spectra of seven stars ordered by spectral type ranging from the hottest (O-type) at the top to the coolest (M-type at the bottom). The x-axis shows the wavelength of light and the y-axis is a measure of the flux of light received at that wavelength. Each spectrum is normalized (the flux at each wavelength is divided by the maximum flux in that spectrum) and the spectra are then offset from each other along the y-axis to make the plot easier to view. The colour of the lines between 400 nm and 700 nm roughly corresponds to the colour the human eye would see light of that wavelength. Below 400 nm and above 700 nm, where the human eye can see little to no light, the lines are coloured blue and red respectively.
The hotter stars have more of their flux at the bluer end of the spectrum and the cooler stars have more of their flux at the redder end. However the total amount of flux a star emits depends on its size and temperature. Due to this, a hot star will emit more red light than a cool star of the same size even if the cool star emits almost all its light in red light but this is not visible in this plot due to the normalization mentioned above. The sharp, narrow drops in the spectra are absorption lines caused by atoms and ions in the stars’ atmospheres. The strength of a spectral line depends on the temperature of a star’s atmosphere. Take the hydrogen line at 656.5 nm as an example. All of the stars in this plot are primarily made of hydrogen, but the 656.5 nm hydrogen line is weak for the hottest and coolest stars but strongest for spectral types A and F. This is because hydrogen absorbs more light at 656.5 nm at the temperatures of A and F stars’ atmospheres than in hotter or cooler stars.
The coolest star here, the M-type star, has wide absorption bands in its spectra. This is because this star is cool enough to have compounds such as titanium oxide in its atmosphere. These compounds, often called molecules in astronomy, produce wider spectral absorption features than atoms or ions.
Quelle Diagramm: IAU OAE/SDSS/Niall Deacon.
Diagramm Übersetzungsstatus: Noch nicht bestätigt von einer*einem Rezensent*in
Erstellt mit Unterstützung von: OAE Main Office
Diagramm-Lizenz: Creative Commons Namensnennung 4.0 International (CC BY 4.0) Creative Commons Namensnennung 4.0 International (CC BY 4.0) Symbole
Ähnliche Glossarbegriffe:
Spektralklasse
, Spektrum
, Wellenlänge
Kategorien:
Sterne
Möchtest Du Deine eigene Version dieses Diagramms erstellen? Dann schau dir den Code an der dieses Diagramm erzeugt hat, auf Github
Du kannst Deine eigene Version oder Übersetzung dieses Diagrammes erstellen, indem du einer textlosen Version dieses Diagrammes eigenen Text zufügst.
Downloade einfach eine dieser Dateien:
Download Text-Free File ( Bild 155.72 kB)
Download Text-Free PDF File (PDF file 383.54 kB)
Verlinkte Diagramme
Spectrum of an O-type starSpectrum of a B-type star
Spectrum of an A-type star
Spectrum of an F-type star
Spectrum of a G-type star
Spectrum of a K-type star
Spectrum of an M-type star
Stellar spectral types - bands
Auf anderen Sprachen
Englisch: Stellar spectral typesItalienisch: Tipi spettrali stellari
Französisch: Types spectraux stellaires
Spanisch: Tipos espectrales estelares
Arabisch: الأنواع الطيفية النجمية
Traditionelles Chinesisch: 恒星光譜類型
Vereinfachtes Chinesisch: 恒星光谱类型
Die Diagramm-Unterschriften auf der OAE-Website wurden geschrieben, übersetzt und bestätigt durch einen kollektiven Aufwand vom OAE, dem OAE Zentren und Knotenpunkte, dem OAE Nationale astronomische Bildungskoordinator*innen (NAECs) und anderen Freiwilligen. Du findest eine volle Liste der Mitarbeitenden für unser Übersetzungsprojekt here. Alle Mediendatei-Unterschriften werden veröffentlicht unter Creative Commons CC BY-4.0 license und sollten "IAU OAE" zugeschrieben werden.Die Mediendateien selbst können andere Lizenzen haben (siehe oben), und sollten Quellenverweise erhalten wie oben aufgelistet "credit".
Sollte dir ein Fehler in diesem Diagramm oder seiner Unterschrift auffallen, bitte kontaktiere uns.